VISSOFT
Browse all content with this tag
Visualizing Interaction Data Inside & Outside the IDE to Characterize Developer Productivity
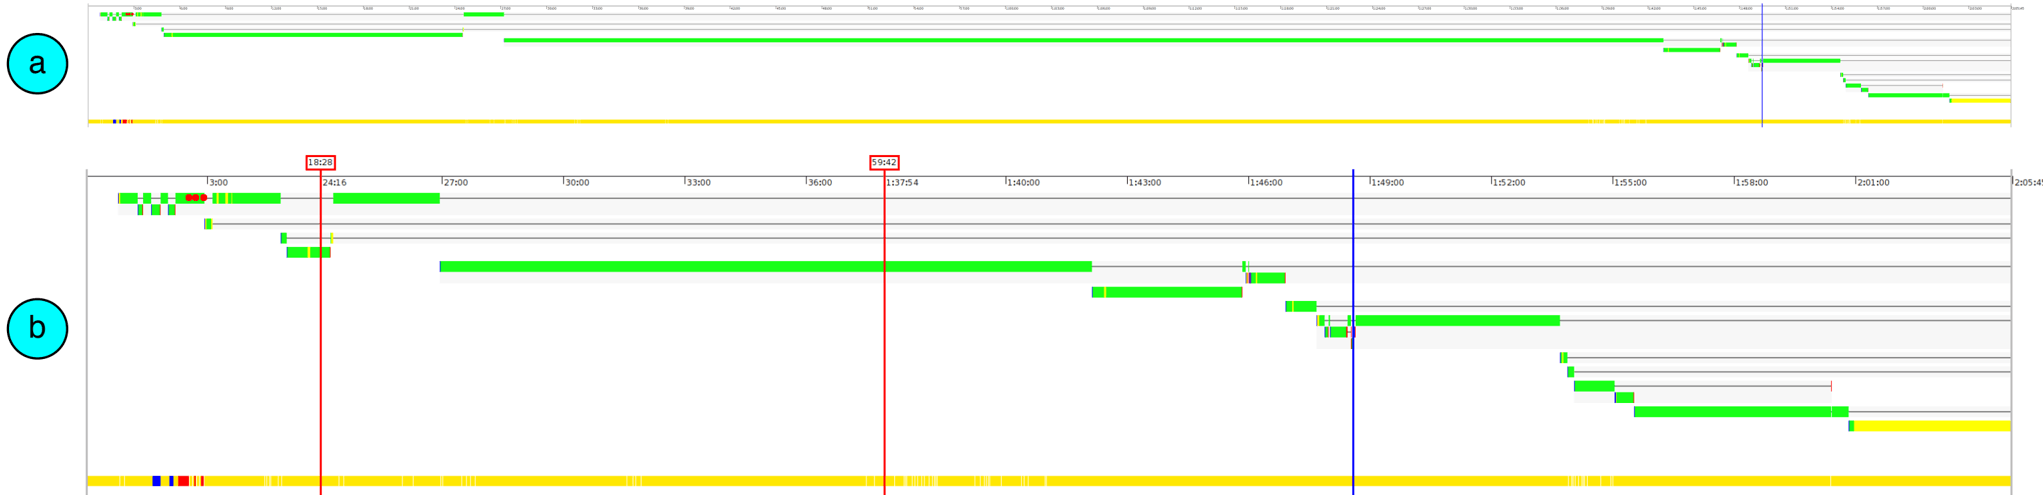
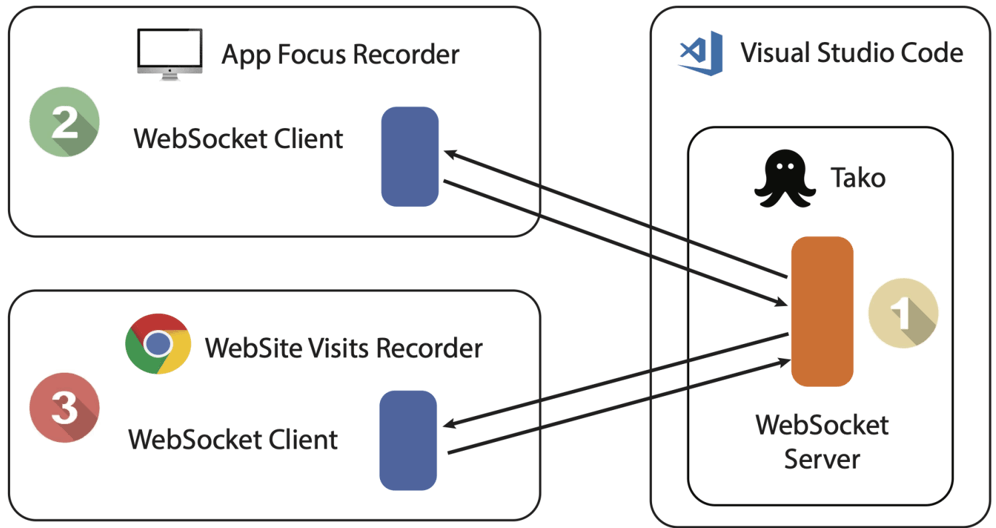
Work fragmentation is a common phenomenon in the workspace, and is detrimental to the actual work taking place. To measure and study the impact of work fragmentation in software development, several studies exploited interaction data, i.e., the data generated by the events performed by the developers in the IDE. However, the absence of information on activities performed outside the IDE could lead to a misclassification of development time. In fact, sometimes leaving the IDE is not an interruption of the task at hand, e.g., when consulting API documentation, or when discussing with colleagues in ad-hoc collaboration applications. In this paper, we propose Ferax, a data analytics platform that developers can leverage for retrospection and possibly to improve their productivity. The capabilities of Ferax are twofold: First, it extends Tako, a profiler to record IDE interaction data for Visual Studio Code, with information about which applications were used and which websites were visited. Second, to enable the understanding of productivity and interruptions on developer sessions, Ferax provides interactive visualizations that show the detailed sequence of events inside and outside the IDE, the switches the developer performs by classifying them as productive or possible interruptions, and the time distribution for application usage. As a preliminary evaluation of Ferax we have collected and analyzed real development sessions from a set of master students and two professional developers. We illustrate how a developer can leverage Ferax to characterize her usual habits, to elicit the impact of interruptions, and to better characterize sessions which were only apparently unproductive.
Visualizing the Evolution of Working Sets
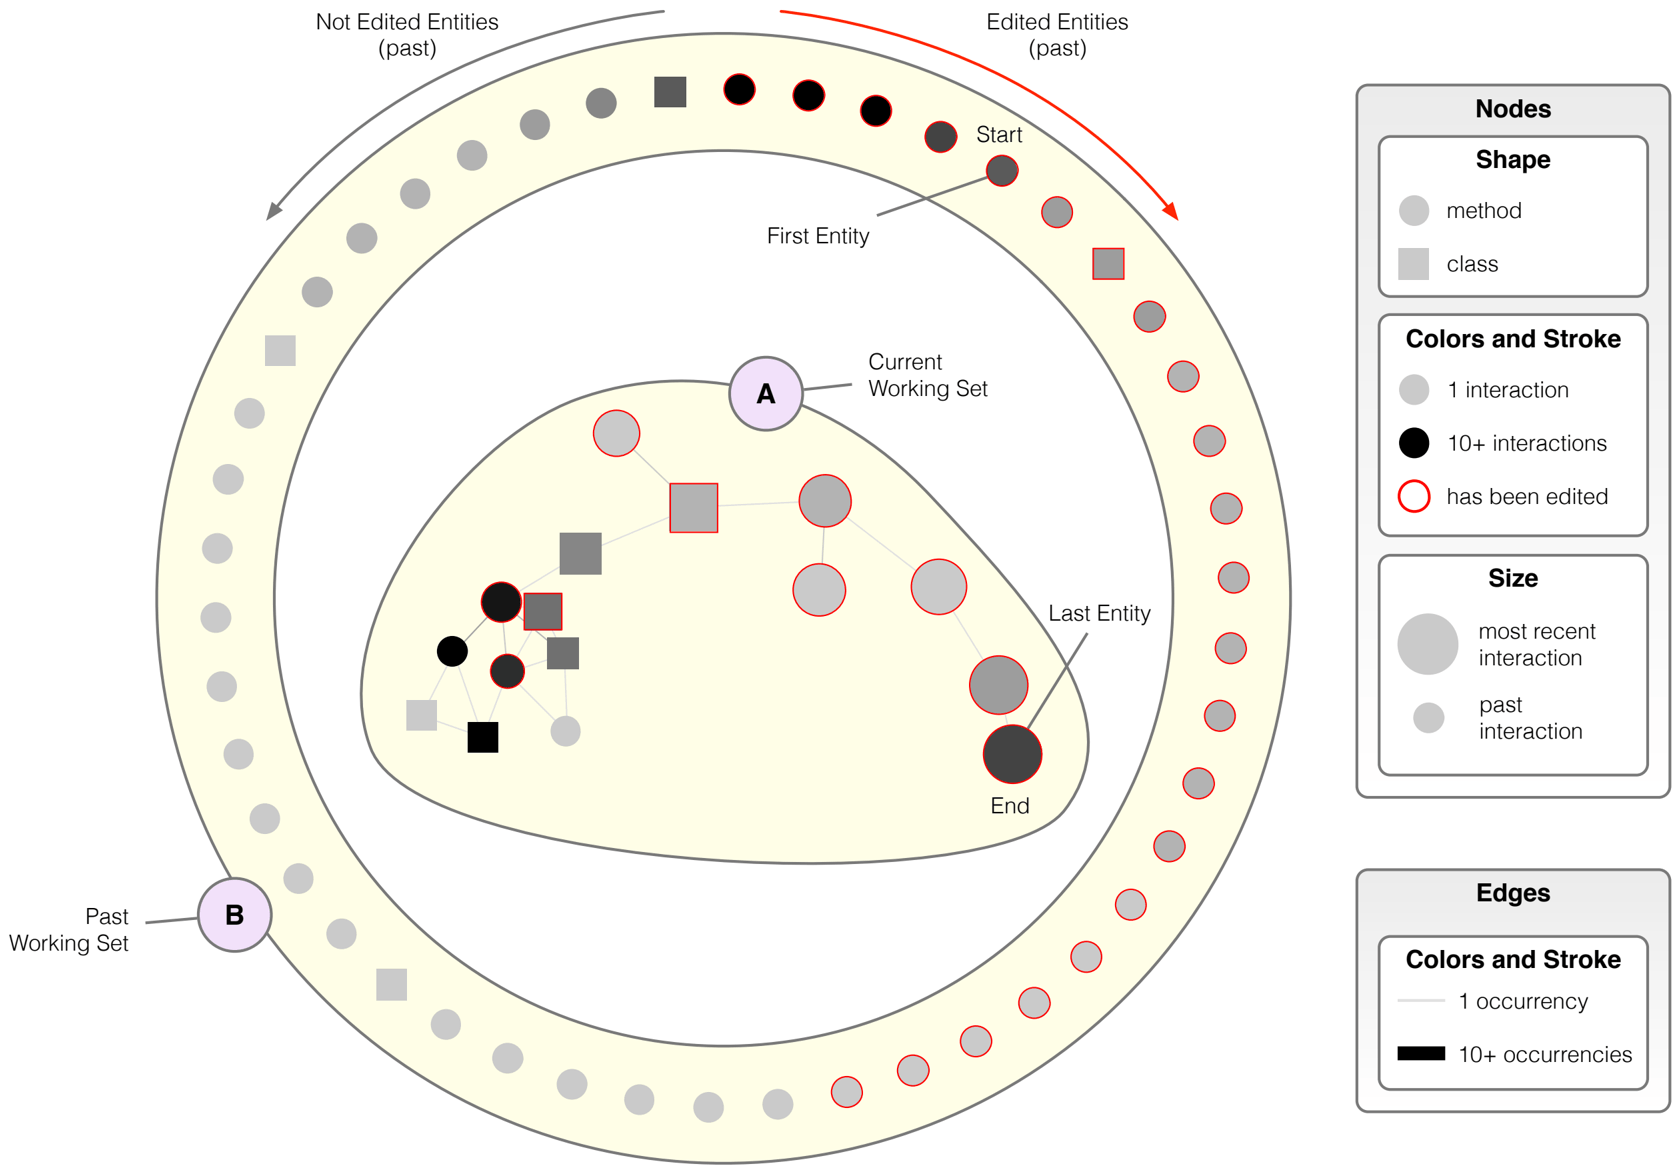
As part as their daily work, developers interact with Integrated Development Environments (IDE), generating thousands of events. Together with other aspects of development, this data also captures the modus operandi of the developer, including all the program entities she interacted with during a development session. This \"working set" (or context) is leveraged by developers to create and maintain their mental model of the software system at hand. Understanding how developers navigate and interact with source code during a development session is an open question. We present a novel visual approach to understand how working sets evolve during a development session. The visualization incrementally depicts all the program entities involved in a development session, the intensity of the developer activity on them, and the navigation paths that occurred between them. We visualized more than a thousand development sessions, and categorized them according to their visual properties.
Blended, Not Stirred: Multi-concern Visualization of Large Software Systems
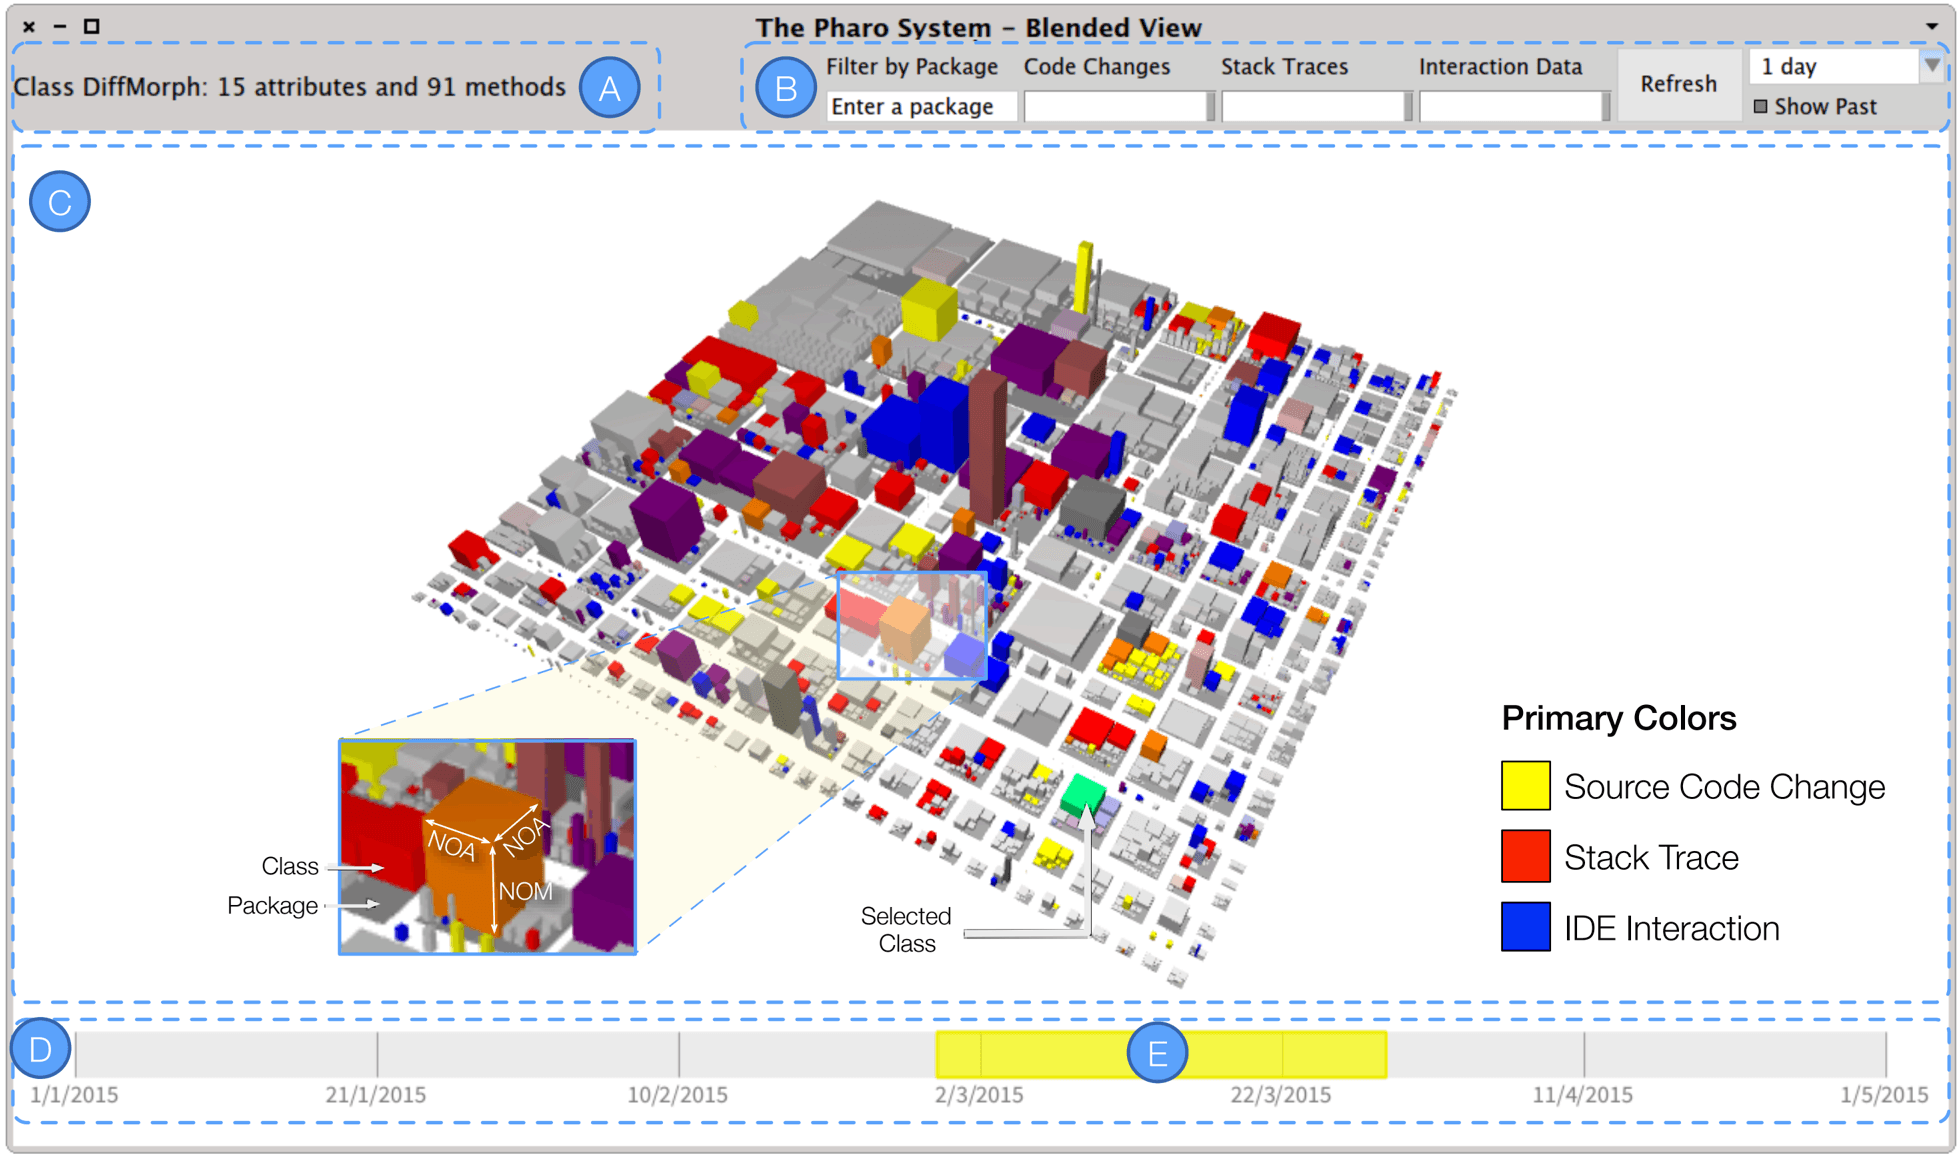
While constructing and evolving software systems, developers generate directly and indirectly a large amount of data of diverse nature, such as source code changes, bug tracking information, IDE interactions, stack traces, etc. Often these diverse data sources are processed and visualized in isolation, leading to a partial view of systems. We present a blended approach to visualize several data \"ingredients" at once, to give as complete an answer as possible to the question "What happened to the system in the last few days?". The goal is to enable a quick and comprehensive assessment of what happened to a software system in any given time frame.
Visualizing Developer Interactions
Integrated Development Environments (IDEs) have become the de facto standard vehicle to develop software systems. The user interface (UI) of an IDE offers a staggering amount of facilities to manipulate source code, such as inspectors, debuggers, recommenders, alternative viewers, etc. It is unclear how developers use the UI of an IDE and whether such UIs actually give appropriate support to the developers. We present a visual approach to understand and characterize development sessions from the UI perspective. The tool supporting our approach mines and processes the finest-grained UI-level events making up development sessions and presents them visually. We have collected, visualized, and analyzed hundreds of development sessions and report on our findings.