Roberto Minelli

Collaborations with Roberto Minelli
 CodeLounge @ Software Institute, USI, Lugano
Projects
HI-SEA: Holistic Immersive Software Evolution Ambient
A holistic immersive ambient for software evolution, integrating the data around a project into a visual environment for analysis and intelligent recommendations.
Teaching and Training Activities
USI Hackathon 2019: Making Data Alive
A three-day hackathon held from 15 to 17 November 2019 in the Aula Magna of the [USI](https://www.usi.ch) campus in Lugano, organized by [CodeLounge](https://codelounge.si.usi.ch), the research and development group of the [Software Institute](https://si.usi.ch), with the support of [Ated4Kids](https://www.ated.ch/progetto_ated4kids.php) and [Lugano Living Lab](https://luganolivinglab.ch). I was part of the organizing team, led by Marco D'Ambros and Michele Lanza together with Mauro Prevostini and Elisa Larghi from the Faculty of Informatics, and with my CodeLounge colleagues Luca Ponzanelli, Davide Paolo Tua, Jesper Findahl, and Roberto Minelli. I also took the pictures of the event, collected in the [Flickr album](https://www.flickr.com/photos/185754239@N08/albums/72157711974256596/). All the details are on the [event website](https://hackathon.usi.ch).
Theses & Projects
Interaction-Aware Development Environments: Recording, Mining, and Leveraging IDE Interactions to Analyze and Support the Development Flow
Roberto Minelli · Doctor of Philosophy in Informatics
Co-Authored Publications
Visualizing the Evolution of Working Sets
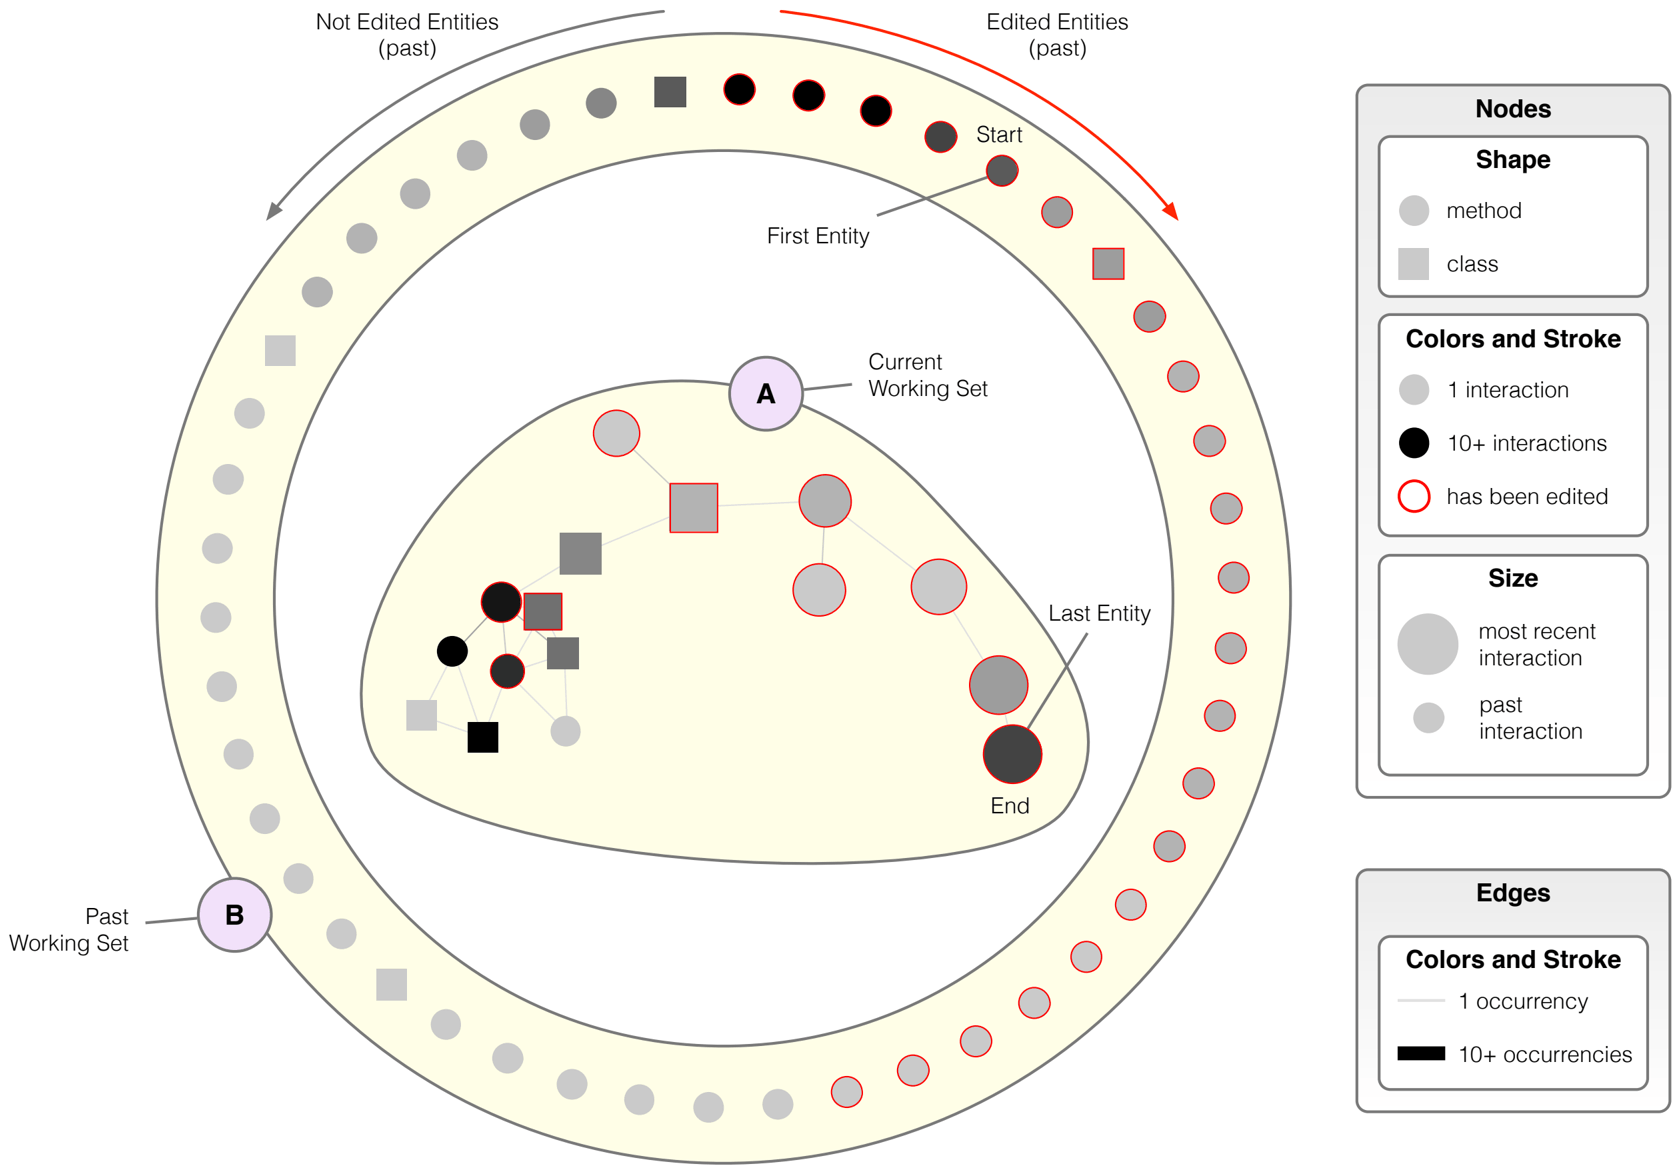
As part as their daily work, developers interact with Integrated Development Environments (IDE), generating thousands of events. Together with other aspects of development, this data also captures the modus operandi of the developer, including all the program entities she interacted with during a development session. This \"working set" (or context) is leveraged by developers to create and maintain their mental model of the software system at hand. Understanding how developers navigate and interact with source code during a development session is an open question. We present a novel visual approach to understand how working sets evolve during a development session. The visualization incrementally depicts all the program entities involved in a development session, the intensity of the developer activity on them, and the navigation paths that occurred between them. We visualized more than a thousand development sessions, and categorized them according to their visual properties.
Taming the IDE with Fine-grained Interaction Data
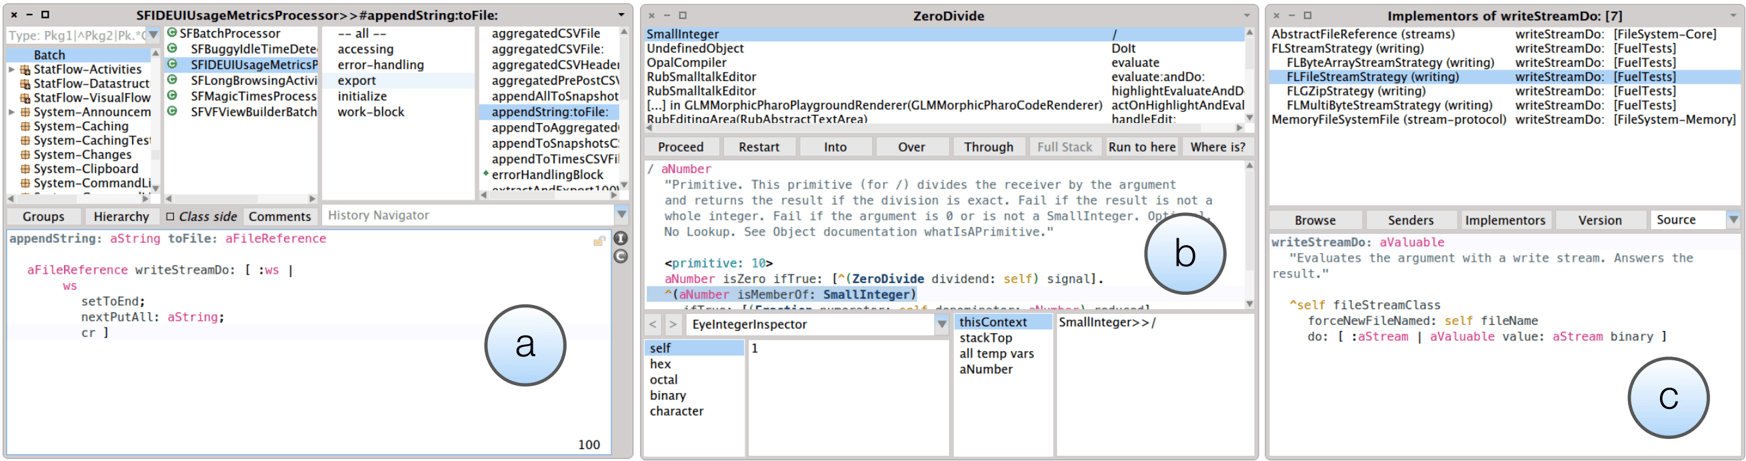
Integrated Development Environments (IDEs) lack effective support to browse complex relationships between source code elements. As a result, developers are often forced to exploit multiple user interface components at the same time, bringing the IDE into a complex, \"chaotic" state. Keeping track of these relationships demands increased source code navigation and cognitive load, leading to productivity deficits documented in observational studies. Beyond small-scale studies, the amount and nature of the chaos experienced by developers in the wild is unclear, and more importantly it is unclear how to tame it. Based on a dataset of fine-grained interaction data, we propose several metrics to characterize and quantify the "level of chaos" of an IDE. Our results suggest that developers spend, on average, more than 30% of their time in a chaotic environment, and that this may affect their productivity. To support developers, we devise and evaluate simple strategies that automatically alter the UI of the IDE. We find that even simple strategies may considerably reduce the level of chaos both in terms of effective space occupancy and time spent in a chaotic environment.
Measuring Navigation Efficiency in the IDE
While coding, developers construct and maintain mental models of software systems to support the task at hand. Although source code is the main product of software development, the process involves navigating and inspecting entities beyond the ones that are edited by the end of a task. Developers use various user interfaces (UI) offered by the Integrated Development Environment (IDE) to navigate the complex, and often hidden, relationships between program entities. These UIs impose fixed navigation costs, in terms of the number of interactions that a developer is required to perform to reach an entity of interest. It is unclear to what extent the actual navigation effort differs from an ideal setting, and if there is any room for actual improvement. We present a preliminary empirical study, where we analyzed a corpus of IDE interaction data coming from 6 developers totaling more than 20 days of development activity. To measure the navigation efficiency, we compute a combination of different ideal settings and compare them against the observed navigation events. Our findings reveal that, on average, developers perform 1.5 to 19 times more navigation events than the ideal case. While different factors make the ideal setting unfeasible, we believe that this calls for novel approaches to support the navigation in integrated development environments.
UrbanIt: Visualizing Repositories Everywhere
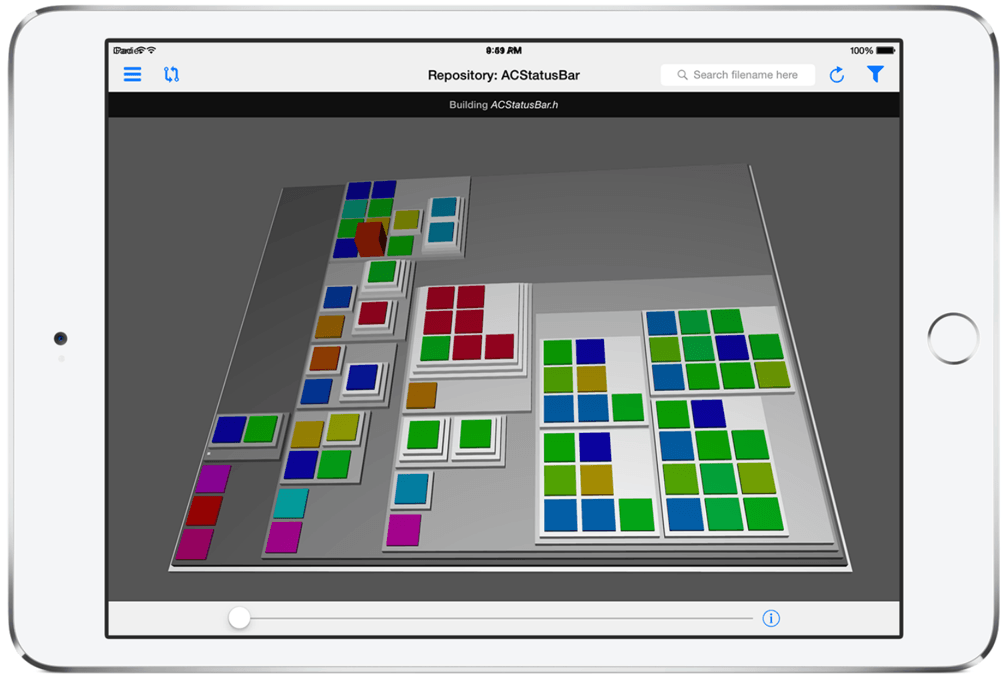
Software evolution is supported by a variety of tools that help developers understand the structure of a software system, analyze its history and support specific classes of analyses. However, the increasingly distributed nature of software development requires basic repository analyses to be always available to developers, even when they cannot access their workstation with full-fledged applications and command-line tools. We present UrbanIt, a gesture-based tablet application for the iPad that supports the visualization of software repositories together with useful evolutionary analyses (e.g., version diff) and basic sharing features in a portable and mobile setting. UrbanIt is paired with a web application that manages synchronization of multiple repositories.
SODA: The Stack Overflow Dataset Almanac
Stack Overflow has become a fundamental resource for developers, becoming the de facto Question and Answer (Q&A) website, and one of the standard unstructured data sources for software engineering research to mine knowledge about development. We present SODA, the Stack Overflow Dataset Almanac, a tool that helps researchers and developers to better understand the trends of discussion topics in Stack Overflow, based on the available tagging system. SODA provides an effective visualization to support the analysis of topics in different time intervals and frames, leveraging single or co-occurrent tags. We show, through simple usage scenarios, how SODA can be used to find interesting peculiar moments in the evolution of Stack Overflow discussions that closely match specific recent events in the area of software development. SODA is available at http://rio.inf.usi.ch/soda/
Blended, Not Stirred: Multi-concern Visualization of Large Software Systems
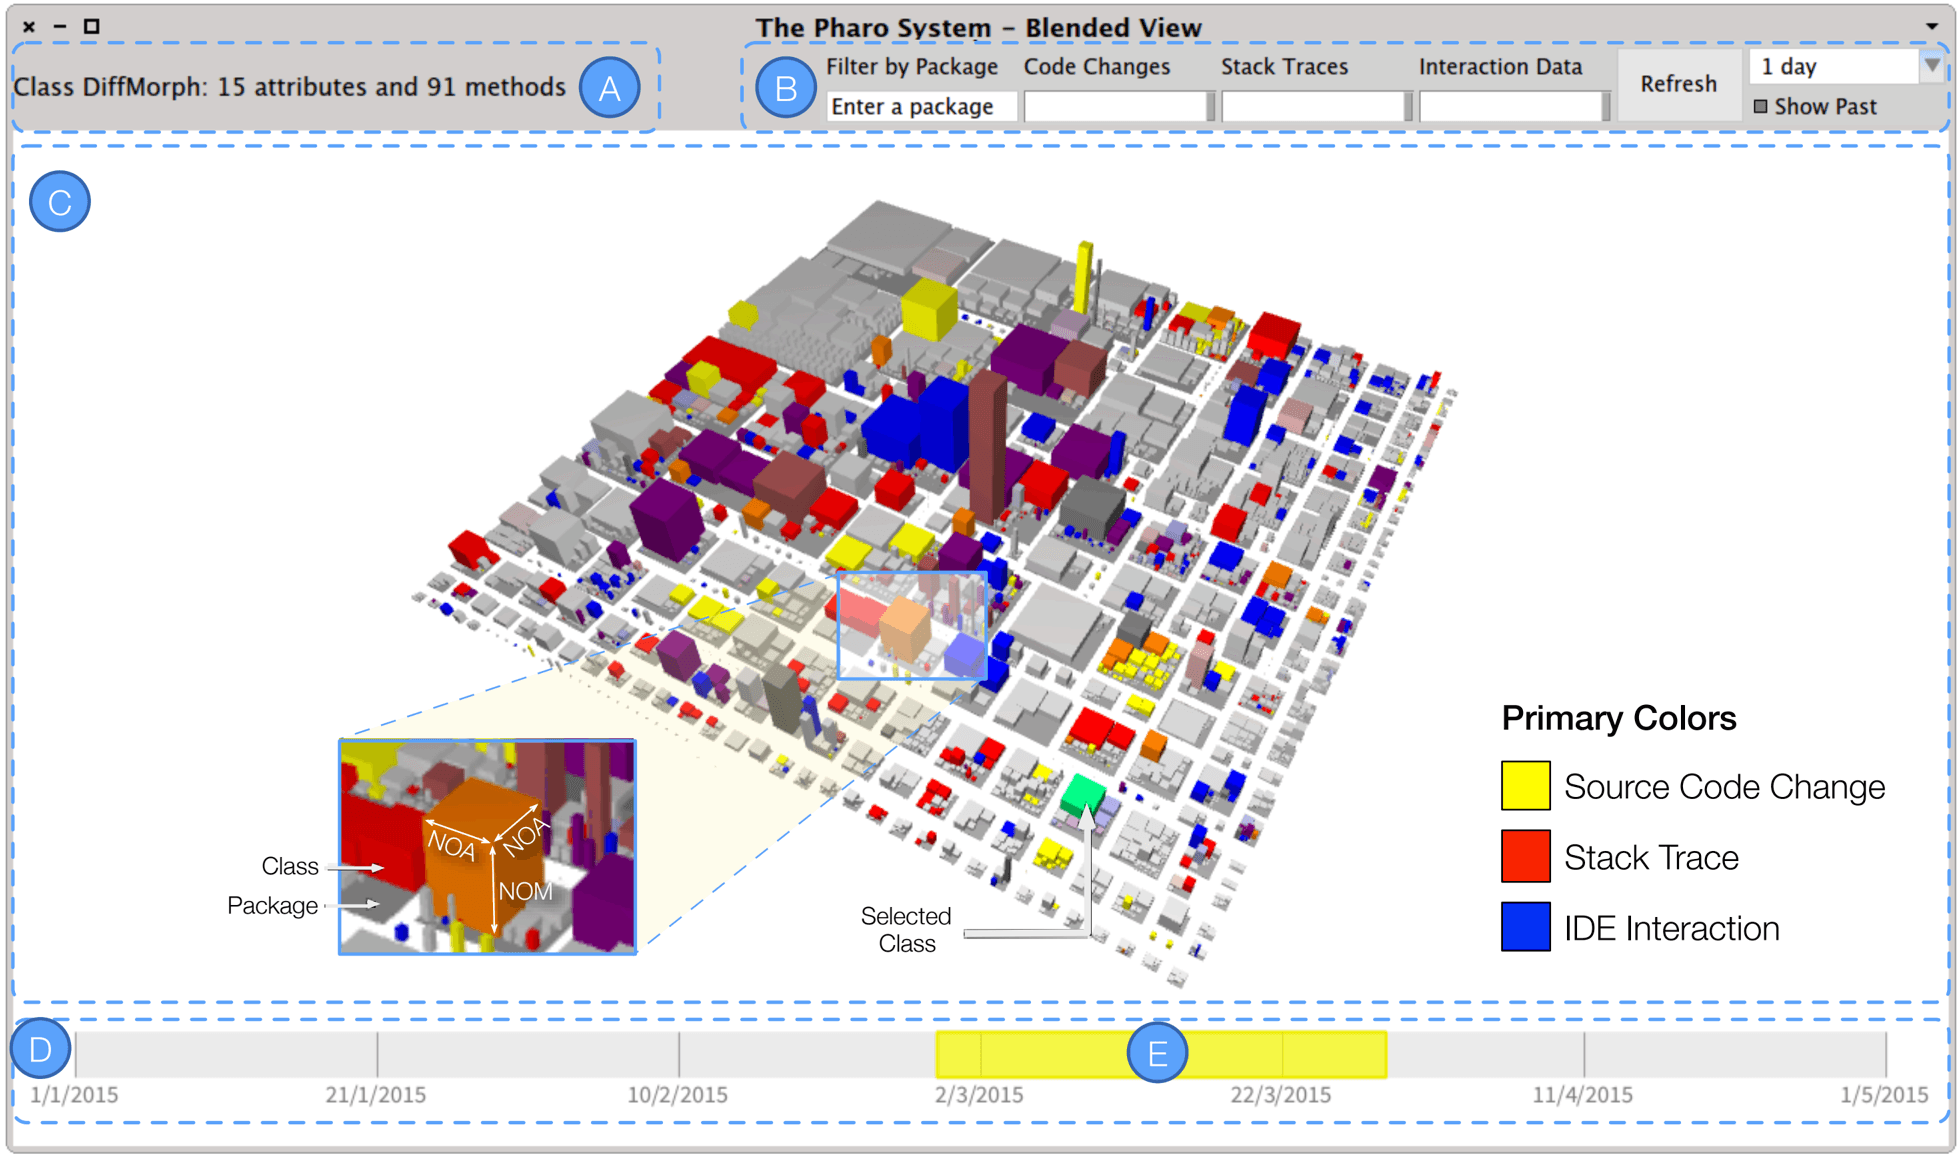
While constructing and evolving software systems, developers generate directly and indirectly a large amount of data of diverse nature, such as source code changes, bug tracking information, IDE interactions, stack traces, etc. Often these diverse data sources are processed and visualized in isolation, leading to a partial view of systems. We present a blended approach to visualize several data \"ingredients" at once, to give as complete an answer as possible to the question "What happened to the system in the last few days?". The goal is to enable a quick and comprehensive assessment of what happened to a software system in any given time frame.
I Know What You Did Last Summer -- An Investigation of How Developers Spend Their Time
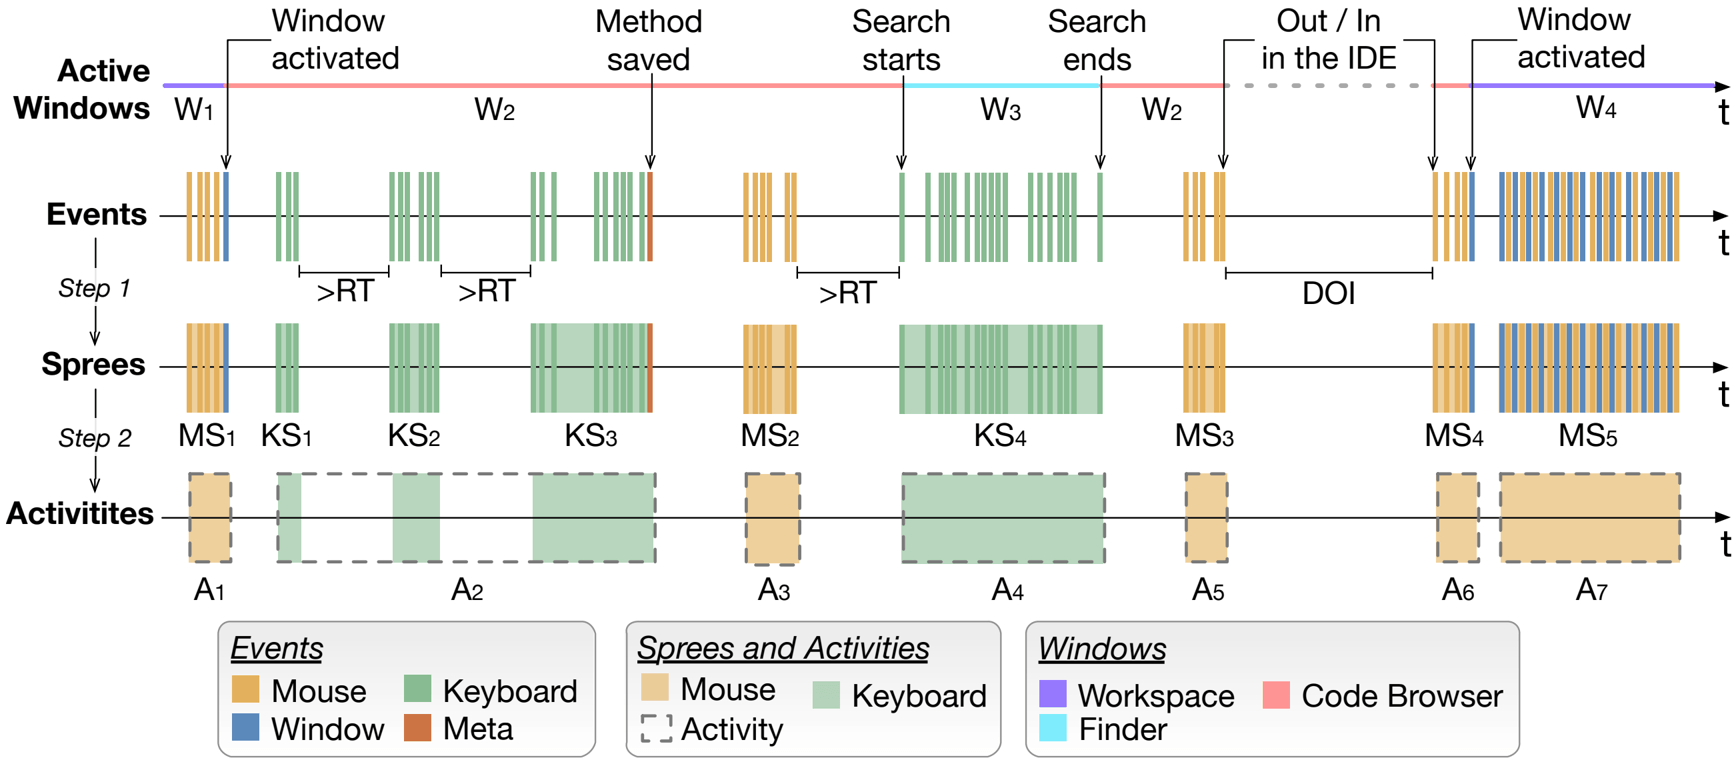
Developing software is a complex mental activity, requiring extensive technical knowledge and abstraction capabilities. The tangible part of development is the use of tools to read, inspect, edit, and manipulate source code, usually through an IDE (integrated development environment). Common claims about software development include that program comprehension takes up half of the time of a developer, or that certain UI (user interface) paradigms of IDEs offer insufficient support to developers. Such claims are often based on anecdotal evidence, throwing up the question of whether they can be corroborated on more solid grounds. We present an in-depth analysis of how developers spend their time, based on a fine-grained IDE interaction dataset consisting of ca. 740 development sessions by 18 developers, amounting to 200 hours of development time and 5 million of IDE events. We propose an inference model of development activities to precisely measure the time spent in editing, navigating and searching for artifacts, interacting with the UI of the IDE, and performing corollary activities, such as inspection and debugging. We report several interesting findings which in part confirm and reinforce some common claims, but also disconfirm other beliefs about software development.
The Plague Doctor: A Promising Cure for the Window Plague
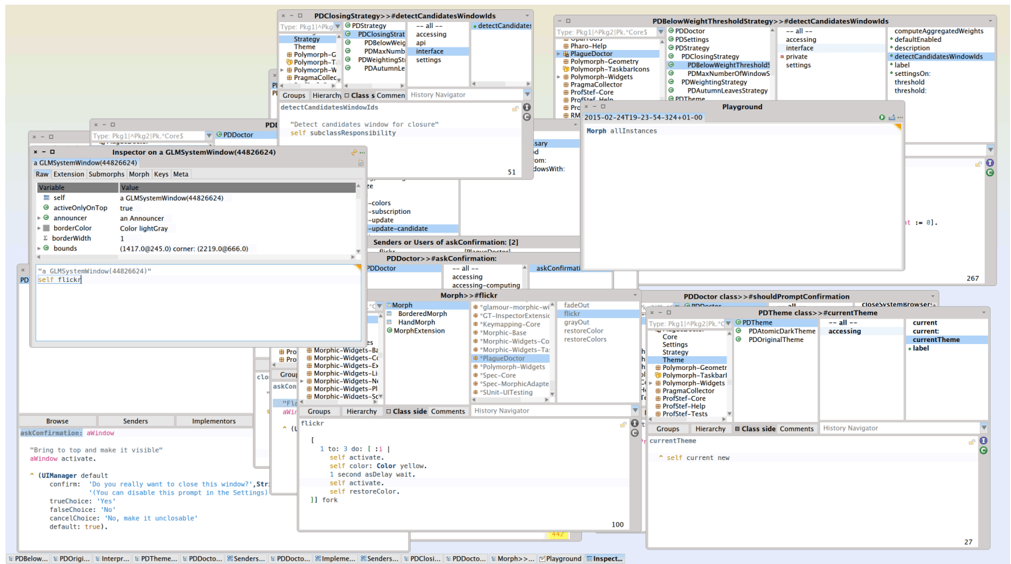
Modern Integrated Development Environments (IDEs) are often affected by the \"window plague", an overly crowded workspace with many open windows and tabs. The main cause is the lack of navigation support in IDEs, also due to the many - and not always obvious - complex relationships that exist between program entities. Researchers have shown that it is possible to mitigate the window plague by exploiting the data obtained by monitoring how developers interact with the user interface of the IDE. However, despite initial results the approach was never fully integrated in an IDE. In our previous work, we implemented DFLOW, an automatic interaction profiler that monitors all the fine-grained interactions of the developer with the IDE. Here we present a first prototype of the PLAGUE DOCTOR, a tool that seamlessly detects the windows that are less likely to be used in the future and automatically closes them. We discuss our long term vision on how to fully exploit the interaction data recorded by DFLOW to provide a more effective cure for the window plague.
Free Hugs: Praising Developers For Their Actions
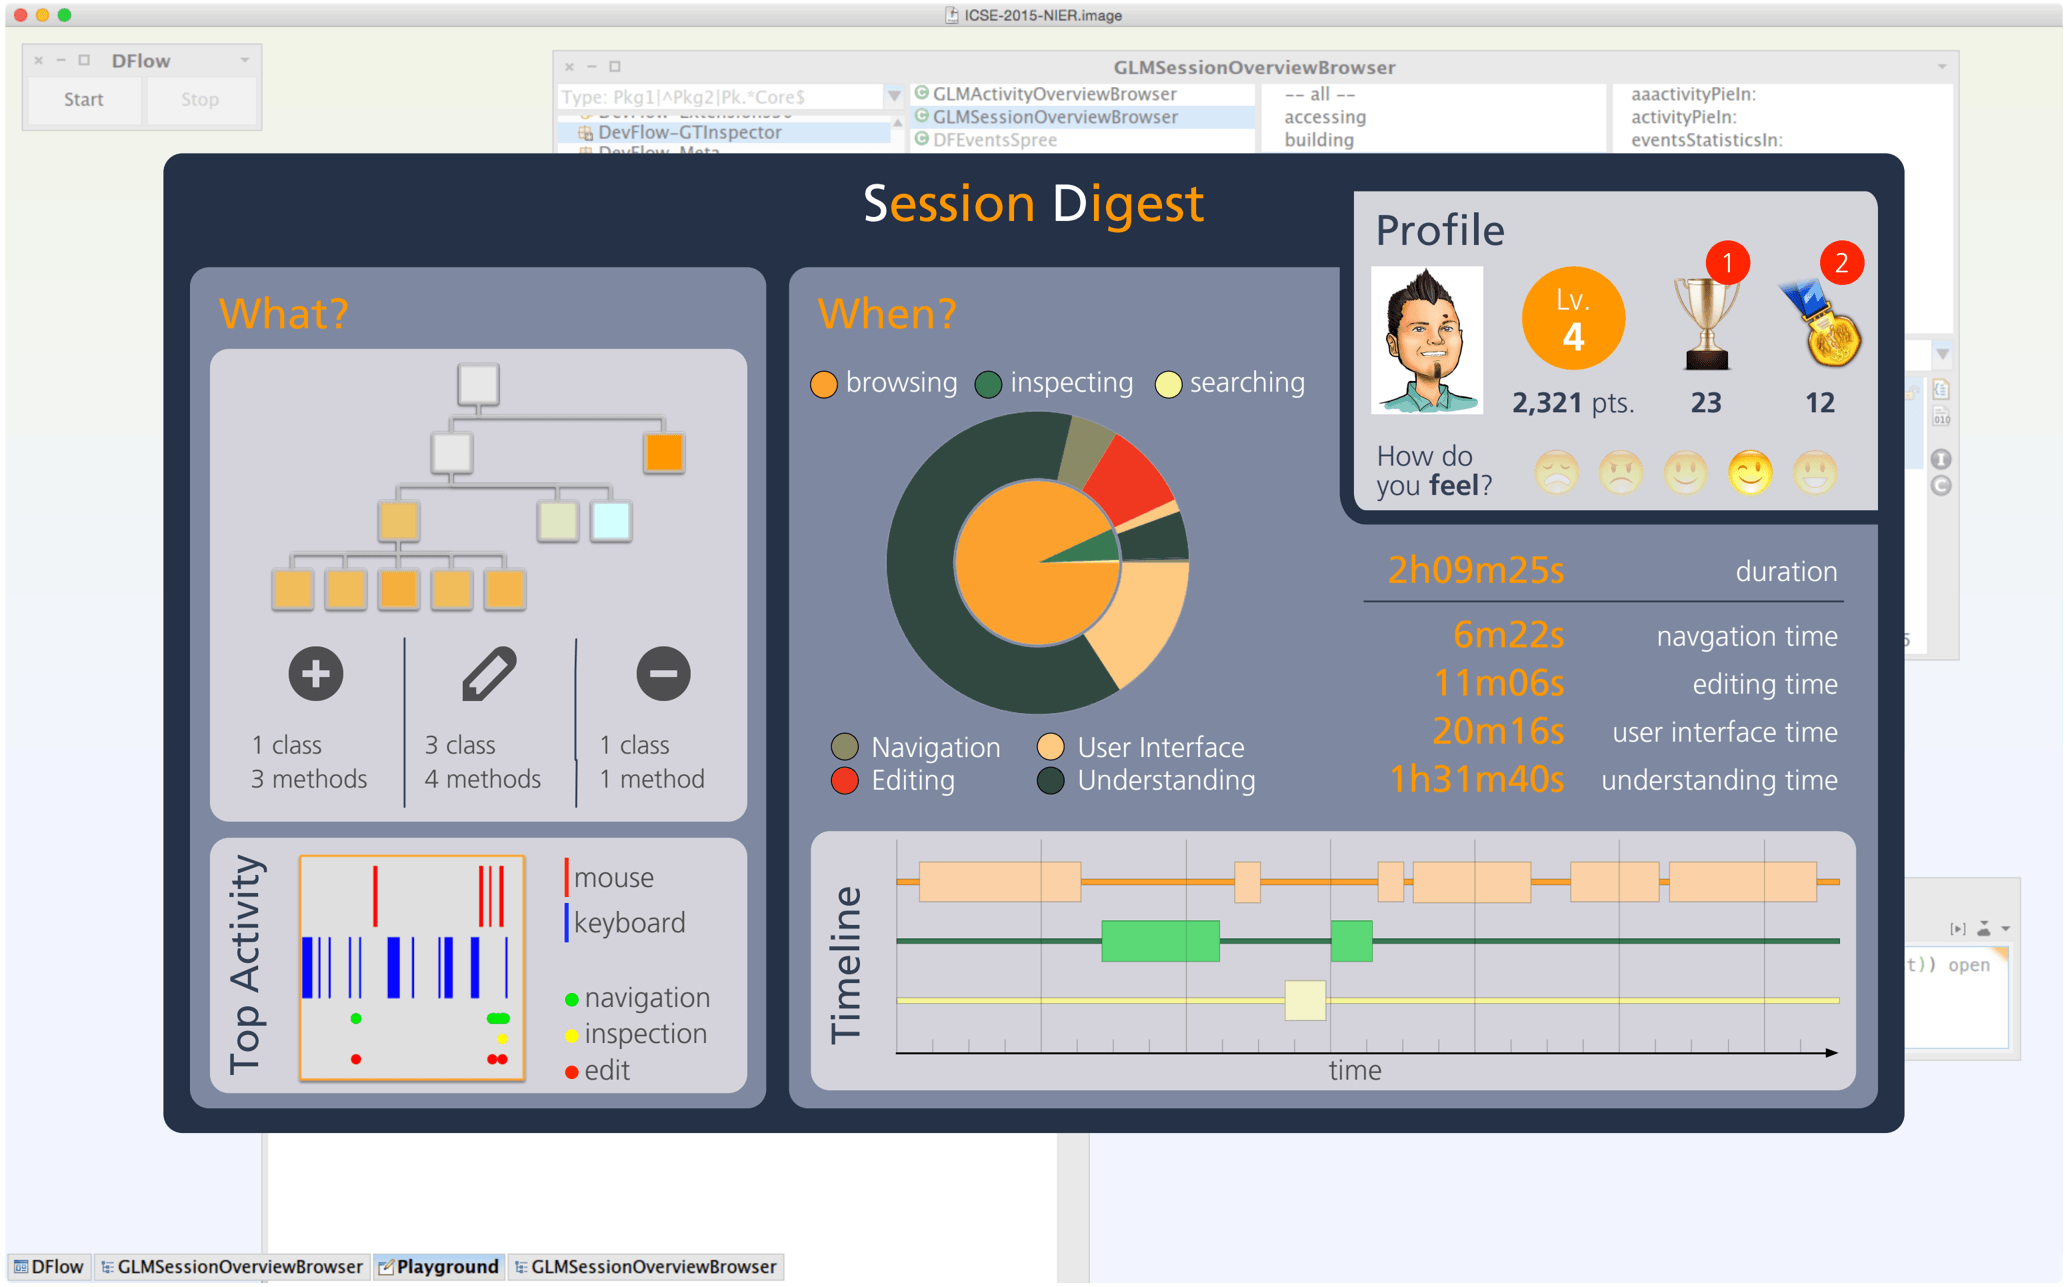
Developing software is a complex, intrinsically intellectual, and therefore ephemeral activity, also due to the intangible nature of the end product, the source code. There is a thin red line between a productive development session, where a developer actually does something useful and productive, and a session where the developer essentially produces “fried air”, pieces of code whose quality and usefulness are doubtful at best. We believe that well-thought mechanisms of gamification built on fine-grained interaction information mined from the IDE can crystallize and reward good coding behavior. We present our preliminary experience with the design and implementation of a micro-gamification layer built into an object-oriented IDE, which at the end of each development session not only helps the developer to understand what he actually produced, but also praises him in case the development session was productive. Building on this, we envision an environment where the IDE reflects on the deeds of the developers and by providing a historical view also helps to track and reward long-term growth in terms of development skills, not dissimilar from the mechanics of role-playing games.
Quantifying Program Comprehension with Interaction Data
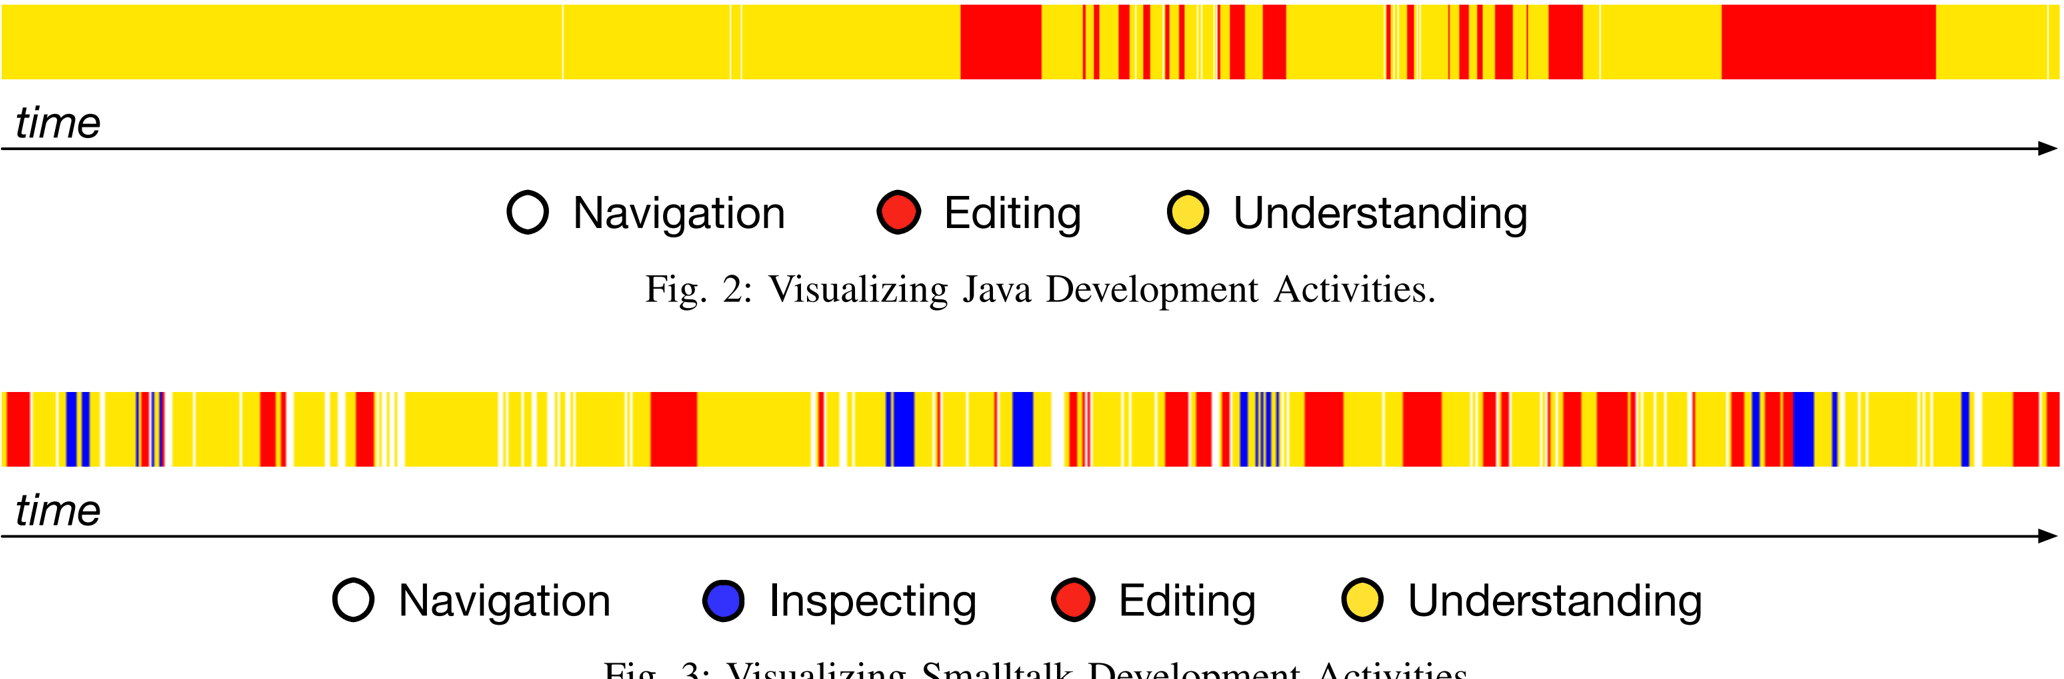
It is common knowledge that program comprehension takes up a substantial part of software development. This \"urban legend" is based on work that dates back decades, which throws up the question whether the advances in software development tools, techniques, and methodologies that have emerged since then may invalidate or confirm the claim. We present an empirical investigation which goal is to confirm or reject the claim, based on interaction data which captures the user interface activities of developers. We use interaction data to empirically quantify the distribution of different developer activities during software development: In particular, we focus on estimating the role of program comprehension. In addition, we investigate if and how different developers and session types influence the duration of such activities. We analyze interaction data from two different contexts: One comes from the ECLIPSE IDE on Java source code development, while the other comes from the PHARO IDE on Smalltalk source code development. We found evidence that code navigation and editing occupies only a small fraction of the time of developers, while the vast majority of the time is spent on reading & understanding source code. In essence, the importance of program comprehension was significantly underestimated by previous research.
Visualizing Developer Interactions
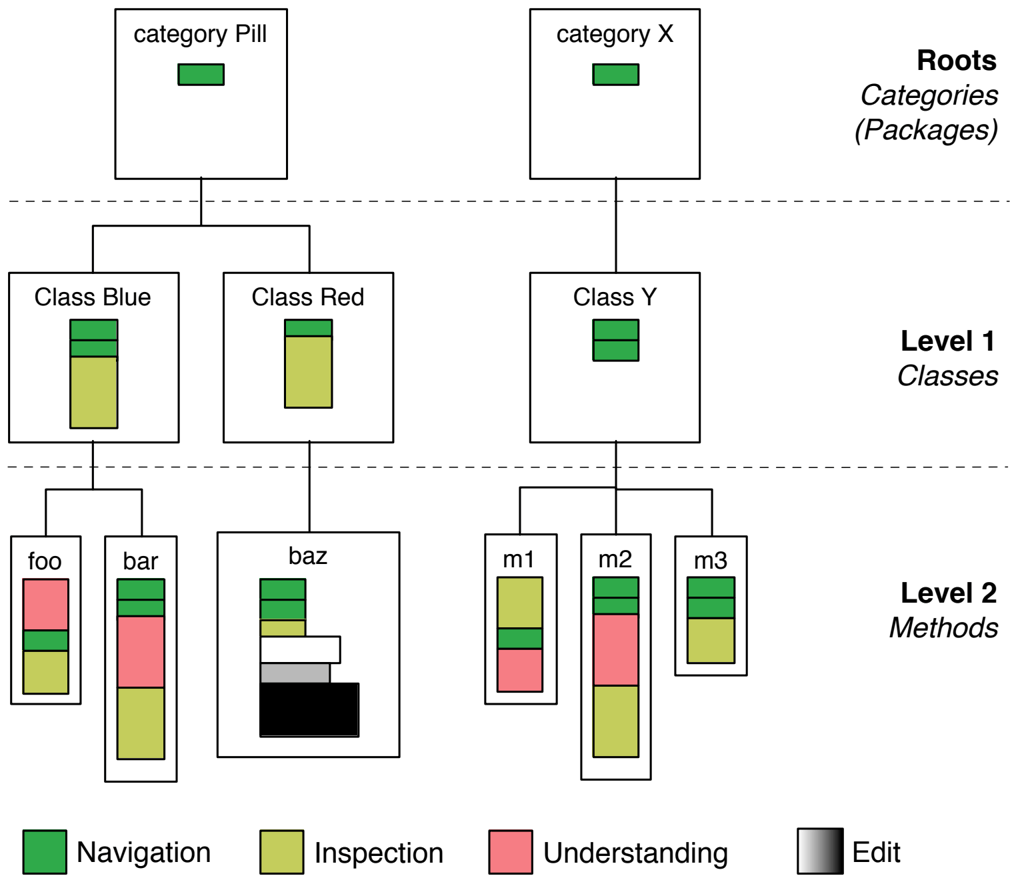
Integrated Development Environments (IDEs) have become the de facto standard vehicle to develop software systems. The user interface (UI) of an IDE offers a staggering amount of facilities to manipulate source code, such as inspectors, debuggers, recommenders, alternative viewers, etc. It is unclear how developers use the UI of an IDE and whether such UIs actually give appropriate support to the developers. We present a visual approach to understand and characterize development sessions from the UI perspective. The tool supporting our approach mines and processes the finest-grained UI-level events making up development sessions and presents them visually. We have collected, visualized, and analyzed hundreds of development sessions and report on our findings.
Visual Storytelling of Development Sessions
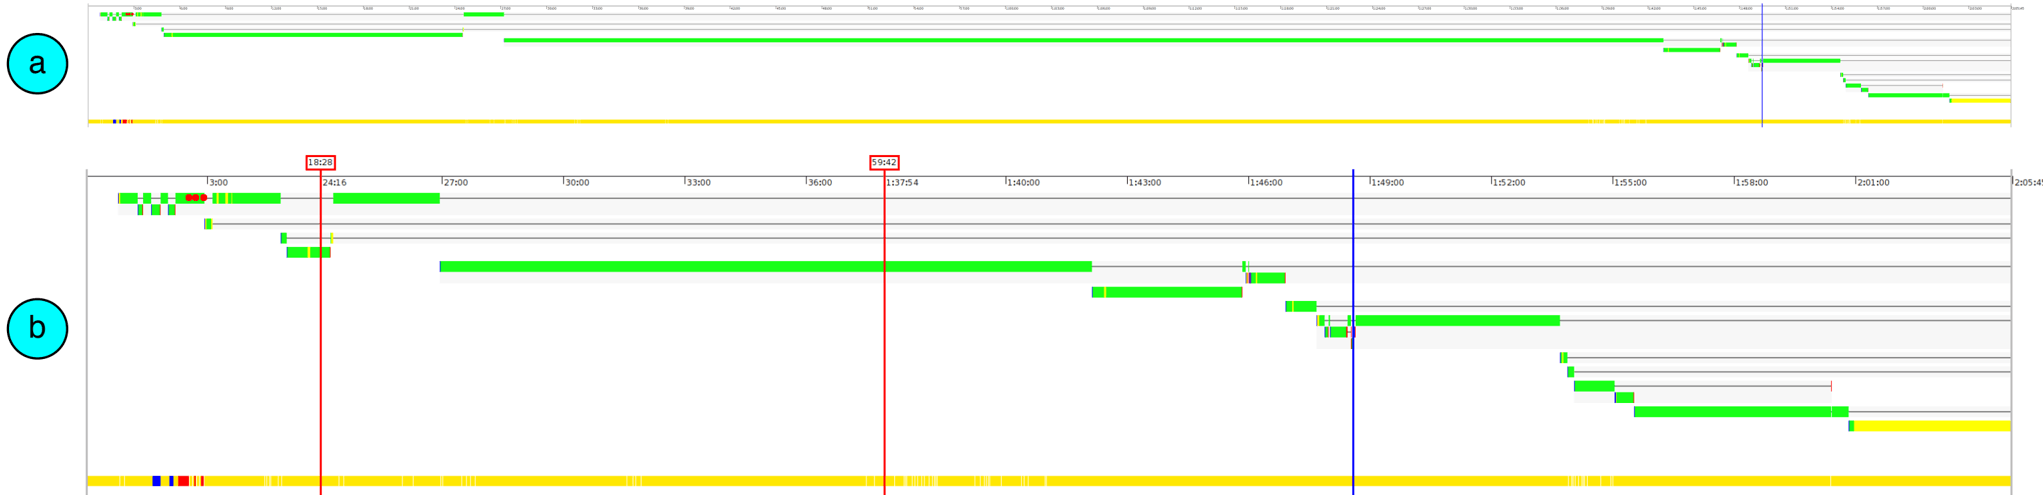
Most development activities, like program understanding, source code navigation and editing, are supported by Integrated Development Environments (IDEs). They provide different tools and user interfaces (UI) to interact with the source code, such as browsers, debuggers, and inspectors. It is uncertain how and when programmers use different UI elements of an IDE and to what extent they appropriately support development. Previously we developed DFLOW, a tool that seamlessly records and processes interaction data. Our long-term goal is to assess to what extent the UIs of IDEs support the workflow of developers and whether they can be improved. As a first step we present our approach to analyze development sessions in the form of visual storytelling. We illustrate our initial catalogue of visualizations through two development stories.