Tako

1 July 2019 IDE Extension
Dormant Latest release: 13 January 2023

A Visual Studio Code extension that records, aggregates, and visualizes IDE interaction data — entirely on the developer's own machine

Overview

Tako is a Visual Studio Code extension that collects, aggregates, and visualizes interaction data. It records fine-grained raw interaction data from the IDE, aggregates it into development activities (e.g., navigation, editing), and provides a set of interactive visualizations that help developers reflect on their activities, and ultimately understand how they spend their time.

In practice, Tako acts as an IDE interaction monitor: once the developer gives consent, it silently records a programming session in the background, showing the recording status in the status bar. Because it builds mostly on the Language Server Protocol, it works with any language whose features are exposed through LSP — Scala through Metals, for instance — in addition to dedicated support for TypeScript and JavaScript.

Recorded sessions are browsed through the Tako Explorer, which groups them by workspace and shows start time, duration, and the number of captured events. Each session gives access to its metadata, to the list of raw LSP events in JSON format, and to the two analytical views described below.

Session Digest

The session digest, inspired by Minelli et al., is the main analytics view provided by Tako. In the digest, you can inspect some basic session statistics, the hottest document section, the timeline, and the hot changes tree.

The hottest document section highlights the top 3 documents according to the number of events. Events are grouped by their type: Edit events, Navigation events (e.g., when moving from one method to another one), and Other events (e.g., setting a breakpoint in the debugger).

The timeline shows how events are distributed over time together with a chart which shows the amount of active diagnostics (e.g., errors and warnings).
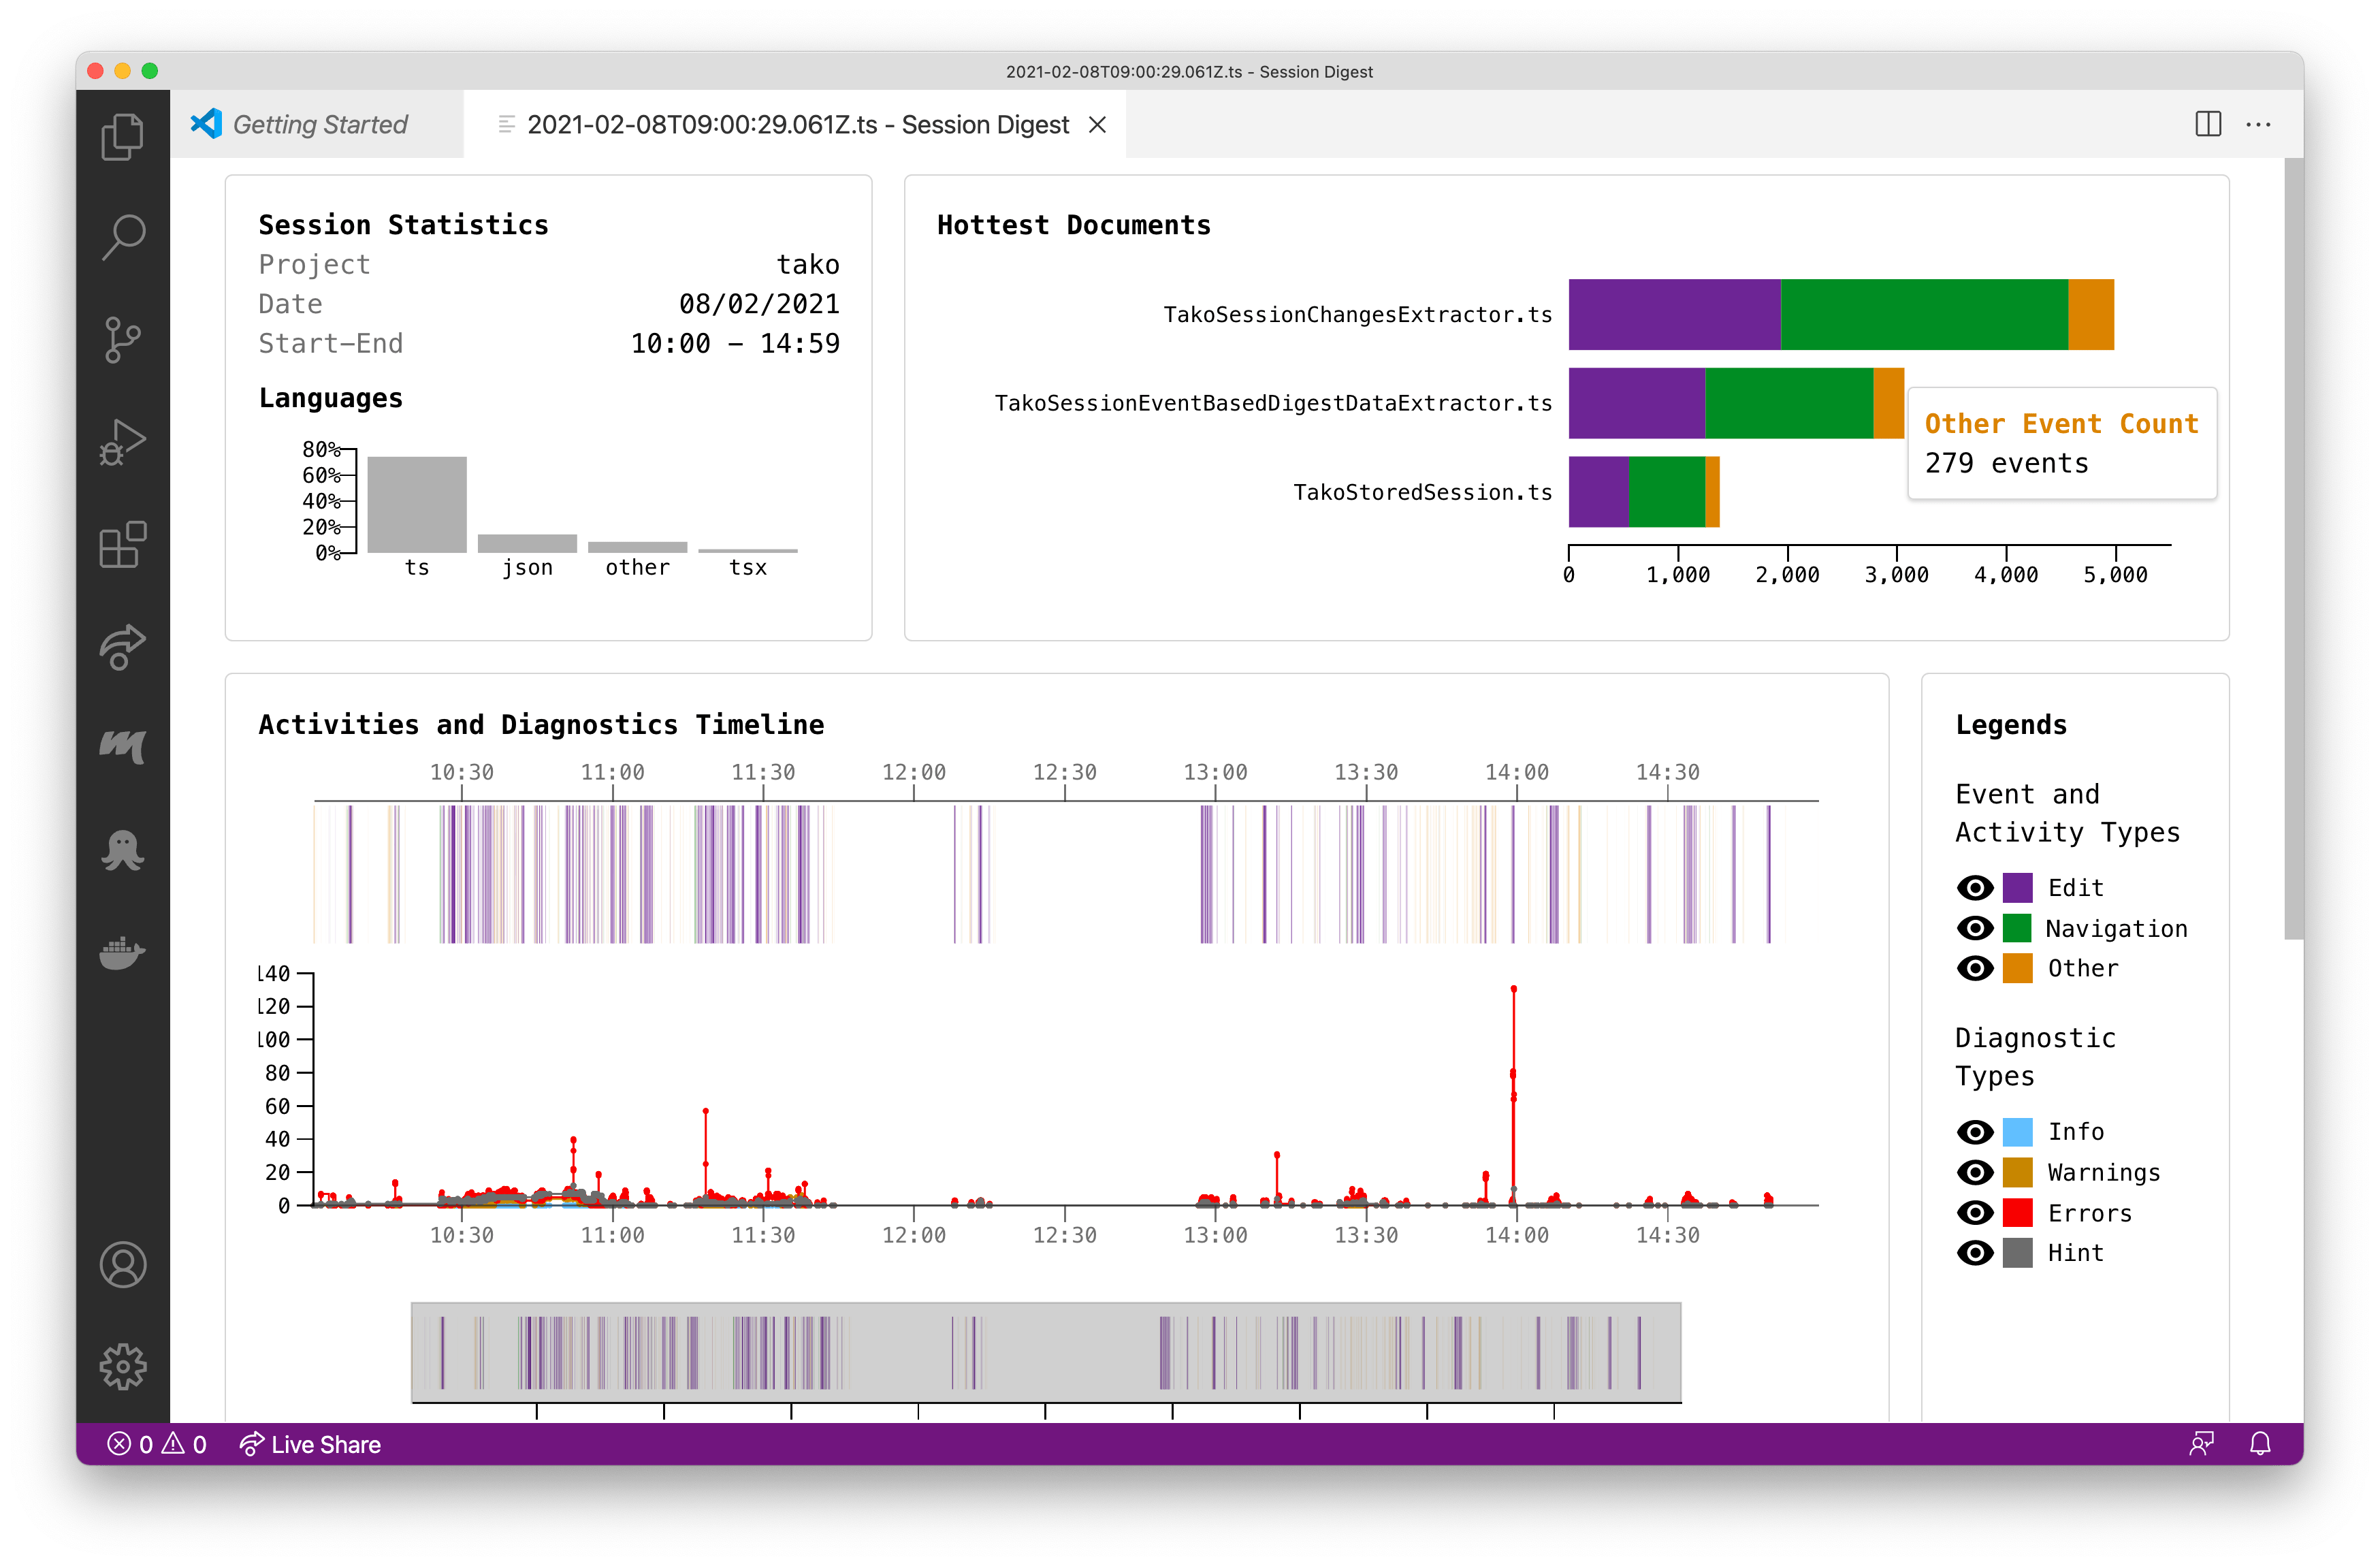
Tako Session Digest

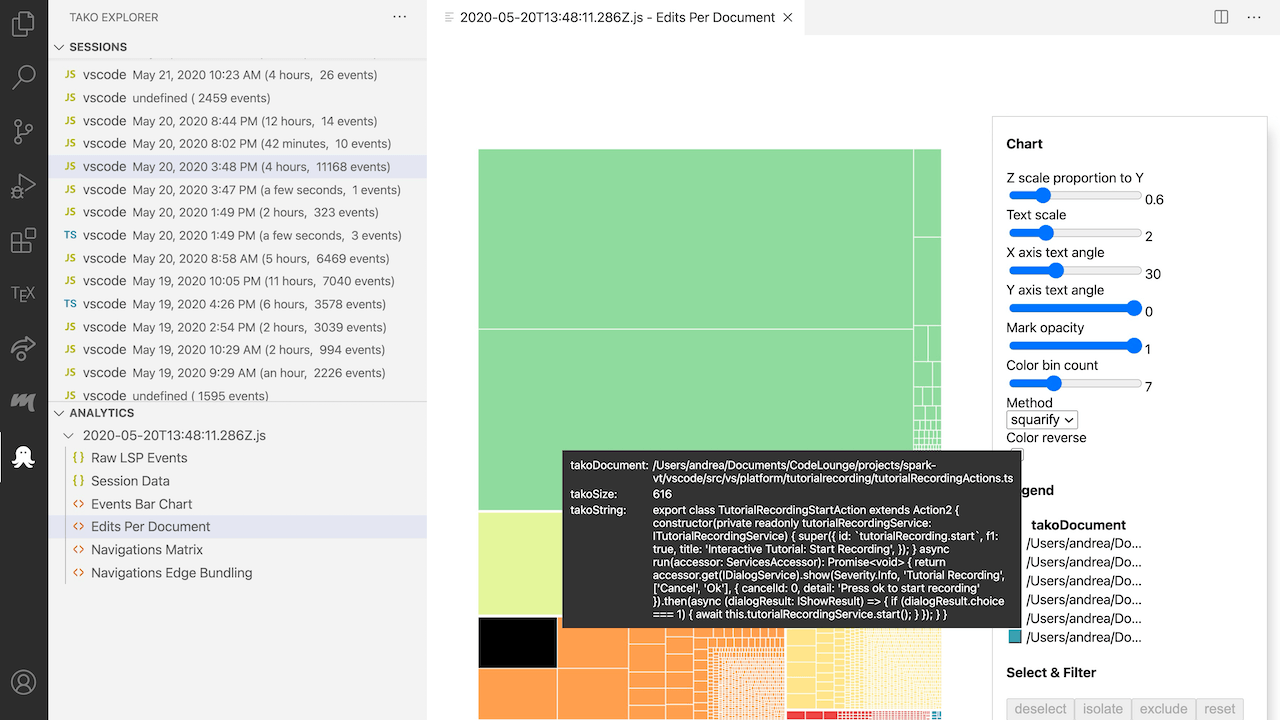
The last part of the session digest shows the hot changes tree and some other statistics. The hot changes tree visualizes the files and program entities which were most involved in edit events. By hovering on a node of the tree, you can inspect its name, type, and number of changes. This will give you a hint on what the session was about.
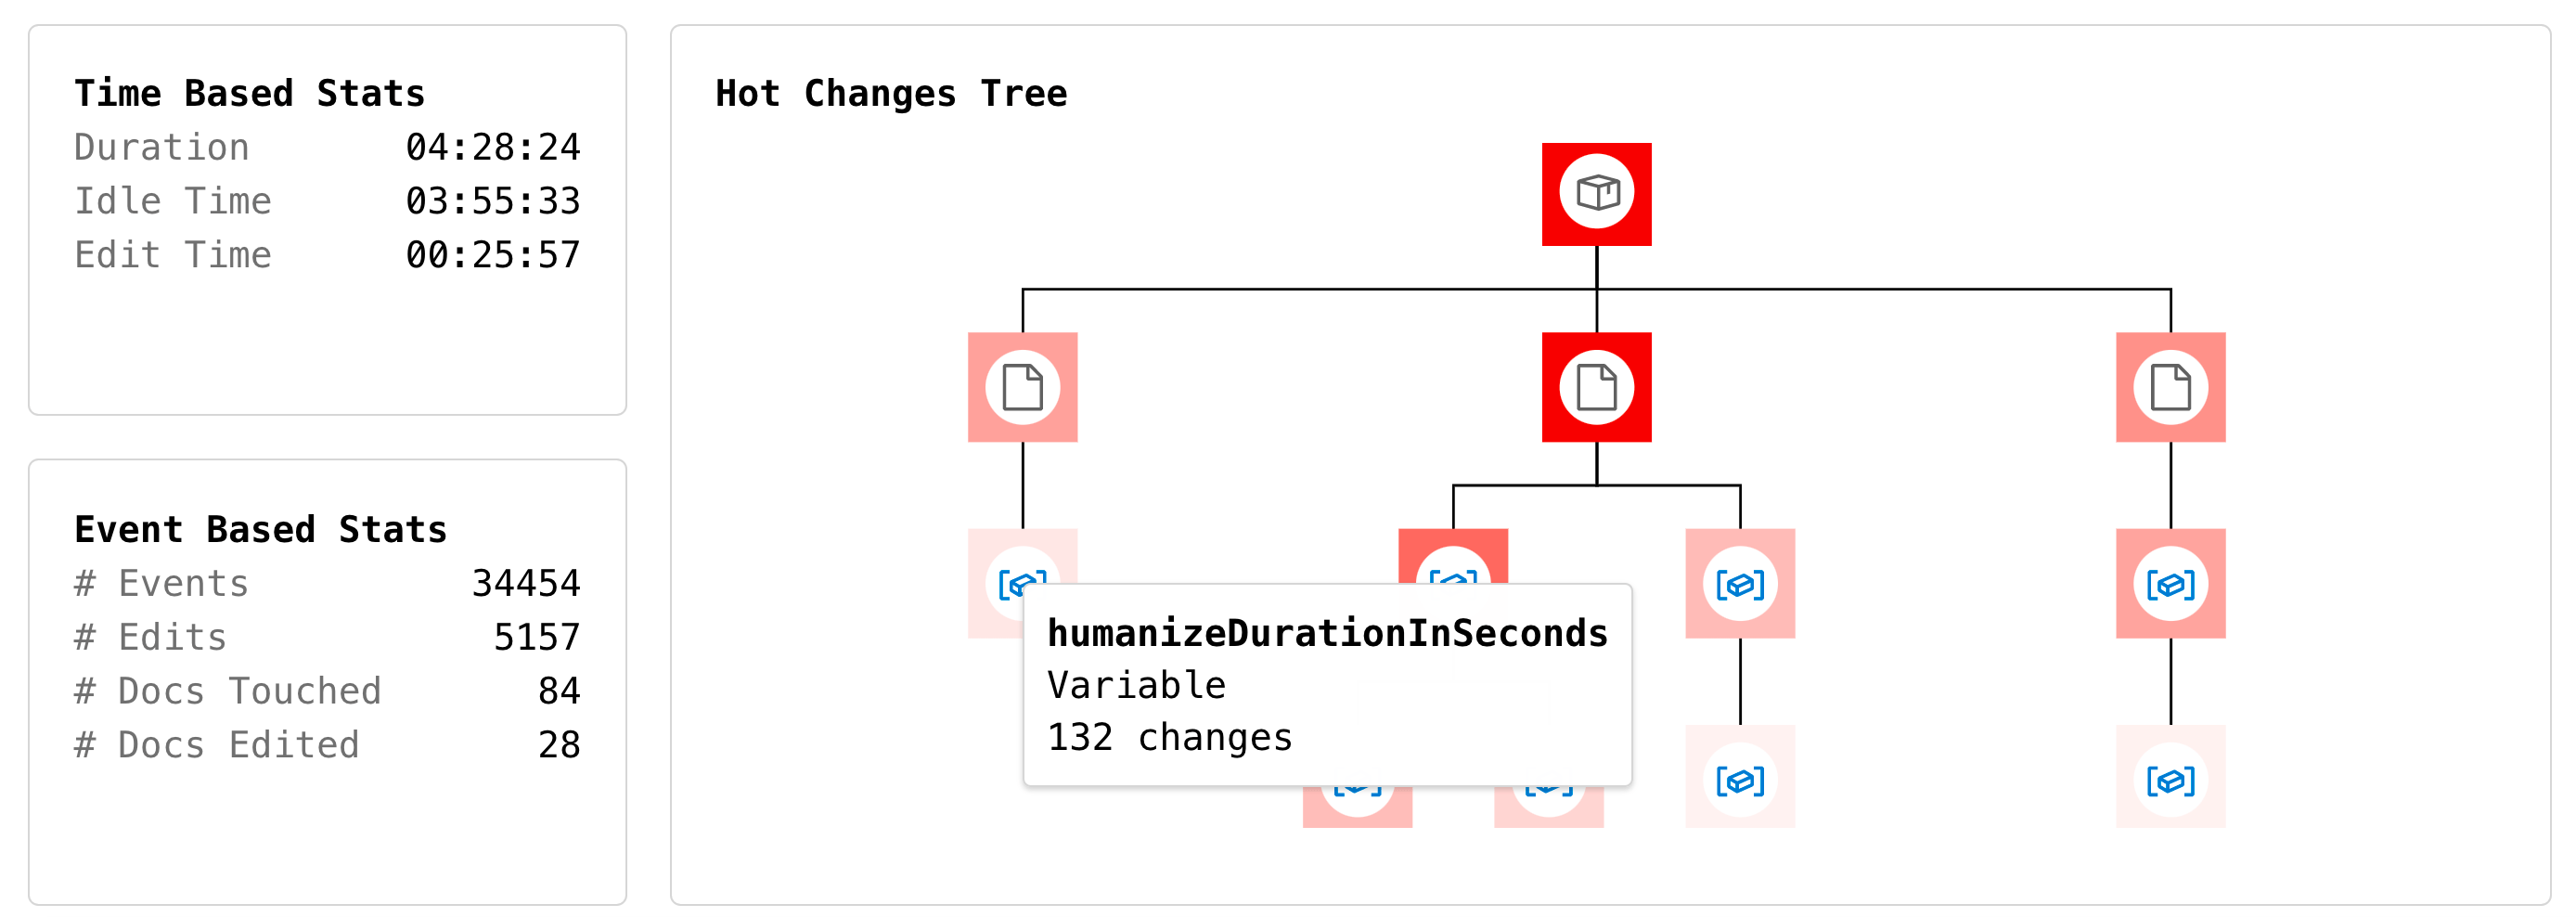
Tako Hot Changes Tree

GitHub Copilot Digest

From version 1.2.0, Tako also tracks GitHub Copilot events. As with the other features, the events are stored only locally. In particular, Tako tracks if you accept a suggestion or not. You can see basic statistics on your Copilot usage in a dedicated analytics view, the Copilot Digest, that you can access from the usual panel.
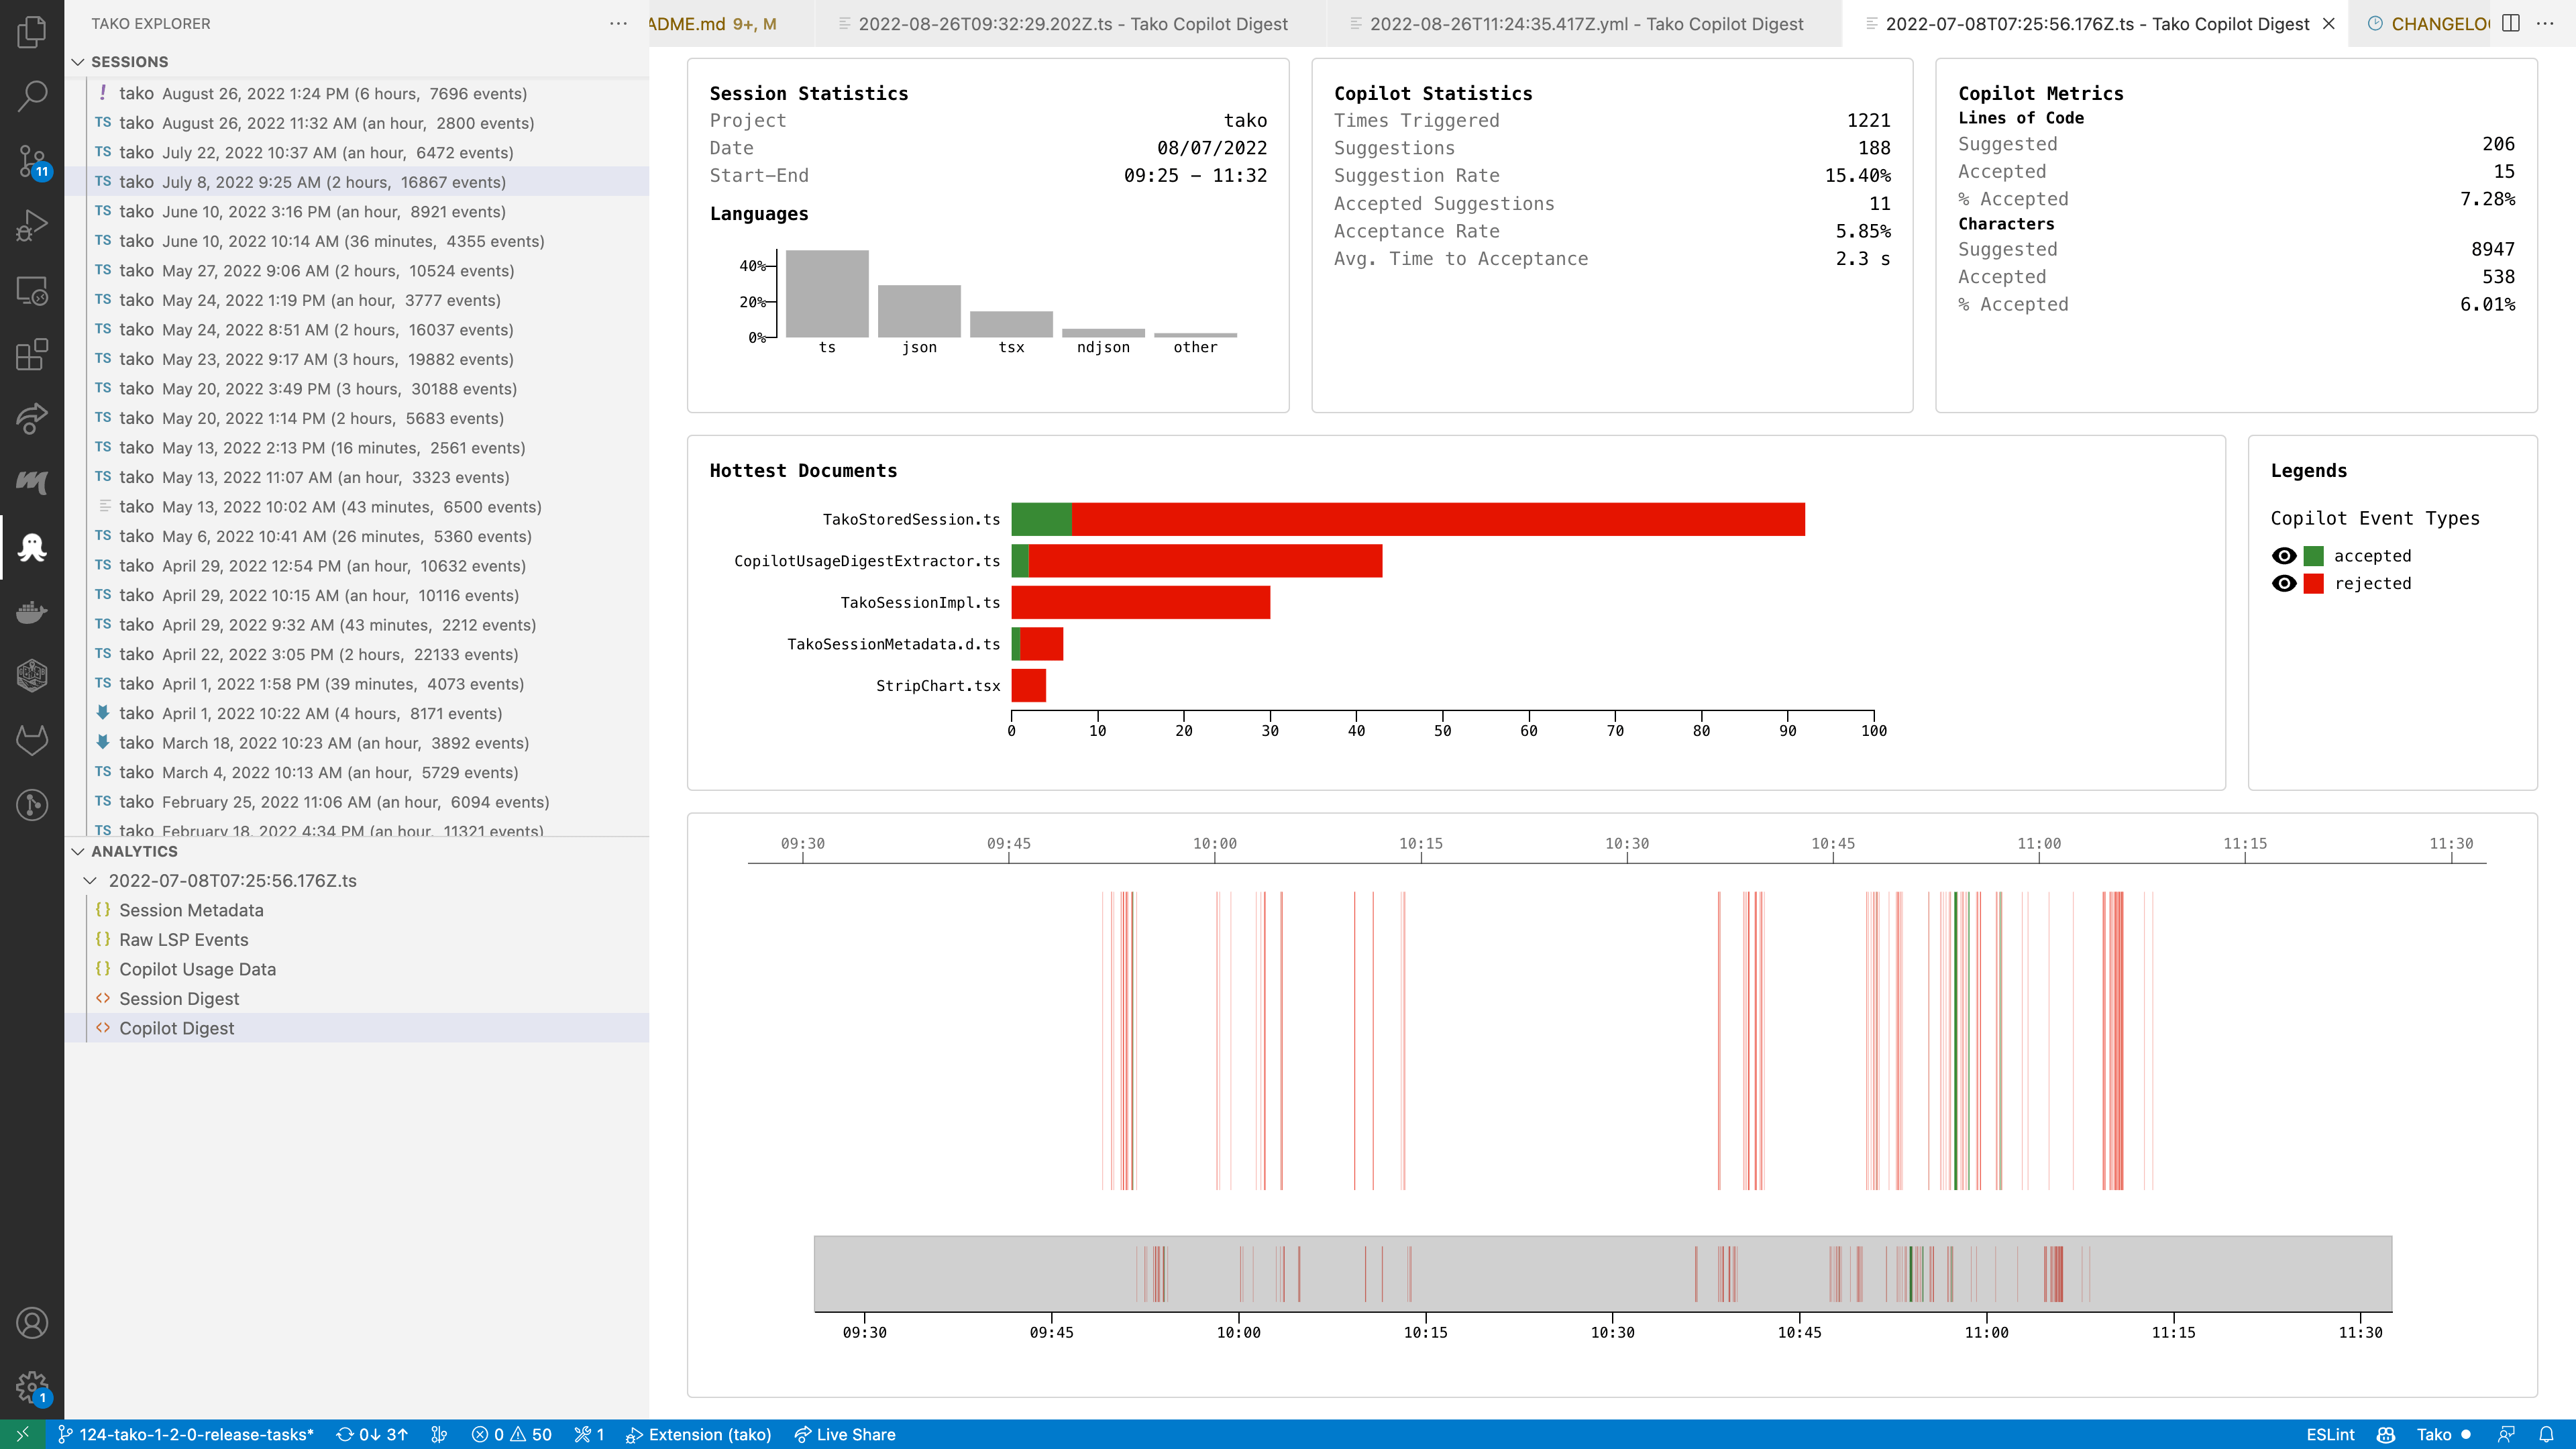
Tako Copilot Digest

Privacy

Tako is designed around a strict privacy guarantee: it does not send data to any remote server. Everything is stored locally and analyzed on the developer’s own machine, and remains entirely under their control. The extension is freely available on the Visual Studio Marketplace.

Publications

28 September 2020 Paper
7670 words · 39 minutes

Visualizing Interaction Data Inside & Outside the IDE to Characterize Developer Productivity

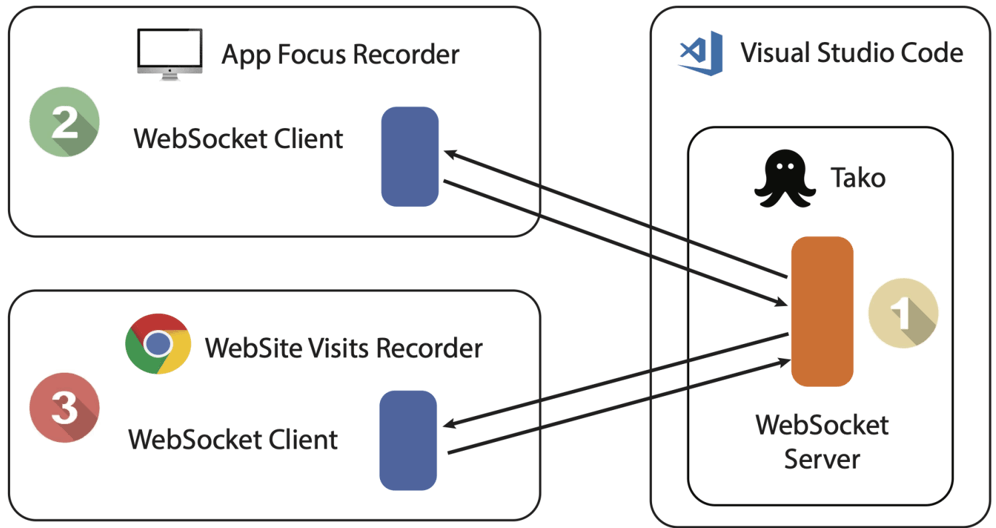
Work fragmentation is a common phenomenon in the workspace, and is detrimental to the actual work taking place. To measure and study the impact of work fragmentation in software development, several studies exploited interaction data, i.e., the data generated by the events performed by the developers in the IDE. However, the absence of information on activities performed outside the IDE could lead to a misclassification of development time. In fact, sometimes leaving the IDE is not an interruption of the task at hand, e.g., when consulting API documentation, or when discussing with colleagues in ad-hoc collaboration applications. In this paper, we propose Ferax, a data analytics platform that developers can leverage for retrospection and possibly to improve their productivity. The capabilities of Ferax are twofold: First, it extends Tako, a profiler to record IDE interaction data for Visual Studio Code, with information about which applications were used and which websites were visited. Second, to enable the understanding of productivity and interruptions on developer sessions, Ferax provides interactive visualizations that show the detailed sequence of events inside and outside the IDE, the switches the developer performs by classifying them as productive or possible interruptions, and the time distribution for application usage. As a preliminary evaluation of Ferax we have collected and analyzed real development sessions from a set of master students and two professional developers. We illustrate how a developer can leverage Ferax to characterize her usual habits, to elicit the impact of interruptions, and to better characterize sessions which were only apparently unproductive.

Visualizing Interaction Data Inside & Outside the IDE to Characterize Developer Productivity

Projects

1 July 2019 Project co-PI

Collecting and Visualizing Development Activities in Visual Studio Code

Tracking low-level IDE interaction events and transforming them into meaningful data to understand our own productivity

Collecting and Visualizing Development Activities in Visual Studio Code
1 July 2019 Project

Collecting and Visualizing Development Activities in Visual Studio Code

Tracking low-level IDE interaction events and transforming them into meaningful data to understand our own productivity

Collecting and Visualizing Development Activities in Visual Studio Code